 |
Oral Agents, Incretins and other "Non-Insulin" Pharmacologic Interventions for Diabetes
Diabetes has reached epidemic proportions in the United States (>23.6 million people or 7.8% of the population) [1] as well as worldwide (>246 million people) and these numbers are projected to increase dramatically [2]. Furthermore, the prevalence of insulin resistance, a major causative factor in the early development of type 2 diabetes and an independent risk factor for cardiovascular disease and the metabolic syndrome X, is even more widespread [3][4][5]. This situation is further exacerbated by obesity, a major risk for developing type 2 diabetes. The number of adults overweight or obese in the US is 125 million (65% of population) and 1.3 billion worldwide [6]. Since dietary modification and increased physical activity provide insufficient glucose control over the long-term course of the disease, the vast majority of patients require some type of pharmacological intervention [7].
In response to the enormity of the growing problem, efforts to identify and develop new pharmacological agents for type 2 diabetes have increased dramatically in recent years. These efforts have resulted in the successful introduction of several new treatment options, and additional new therapies will likely gain regulatory approval (US, Europe, Asia) in the near future. Currently, there are eight classes of oral pharmacological agents available to treat type 2 diabetes: sulfonylureas, meglitinides, metformin (a biguanide), thiazolidinediones, α-glucosidase inhibitors, Dipeptidyl Peptidase IV (DPP-IV) inhibitors, Bile Acid Sequestrants, and Dopamine Agonists. (Table 1). Besides the many forms of insulin (see chapter on insulin), there are also two classes of injectable medications currently used for treatment of diabetes: amylin analogue and GLP Agonists (glucagon like peptide agonist). Medications from these different classes of pharmaceutical agents may be used as treatment by themselves or more often a combination from multiple classes with multiple mechanisms of action is utilized. A variety of ‘fixed combination’ agents have been introduced (Table 2). These products may be useful to the patient as they provide two drugs in a single tablet, presumably offering convenience and increased compliance. They also enable patients to receive two medications for single medical insurance co-pay.
Table 1. Current Oral Pharmacological Therapies Used to Treat Type 2 Diabetes
|
Class |
Brand |
Manufacturer |
Generic Available |
Daily Dose (mg) |
|
|---|---|---|---|---|---|
|
Sulfonylureas |
|||||
|
1st Generation |
|||||
|
Chlorpropamide |
none |
generic |
yes |
100-500 mg qd |
|
| Tolazamide | none | generic | yes | 100-750 mg qd or divided tid | |
|
Tolbutamide |
none | generic | yes |
500-2000 mg qd or divided bid |
|
|
2nd Generation |
|||||
|
Glyburide (Glibenclamide) |
Diabeta |
Aventis |
yes |
2.5-10 mg qd or divided bid |
|
|
Glyburide (Glibenclamide) |
Micronase |
Pharmacia |
yes |
2.5-10 mg qd or divided bid |
|
|
Glyburide (Glibenclamide) |
Glynase |
Pharmacia |
yes |
0.75-12 mg qd or divided bid |
|
|
Glipizide |
Glucotrol |
Pfizer |
yes |
10 mg qd or divided bid |
|
|
Glipizide |
Glucotrol XL |
Pfizer |
yes |
5-10 mg qd |
|
|
Glimepiride |
Amaryl |
Aventis |
yes |
1-4 mg qd |
|
|
Meglitinides |
|||||
|
Repaglinide |
Prandin |
Novo Nordisk |
no |
1.5-2 mg tid |
|
|
Nateglinide |
Starlix |
Novartis |
no |
60-120 mg tid |
|
|
Biguanide |
|||||
|
Metformin |
Glucophage |
Bristol-Myers Squibb |
yes |
500-2500 mg qd-divided tid dosing |
|
|
Metformin |
Glucophage XR |
Bristol-Myers Squibb |
yes |
500-2000 mg qd |
|
|
Thiazolidinediones |
|||||
|
Rosiglitazone (restricted use in US) |
Avandia |
GlaxoSmithKline |
no |
4-8 mg qd, 2-4 bid |
|
|
Pioglitazone |
Actos |
Takeda/Eli Lilly |
no |
15-45 mg qd |
|
|
α-Glucosidase Inhibitors |
|||||
|
Acarbose |
Precose/Glucobay |
Bayer, generics |
yes |
50-100 mg tid |
|
|
Miglitol |
Glyset |
Pharmacia |
50-100 mg tid |
||
| DDP-4 inhibitor | |||||
|
Saxagliptin |
Onglyza | Bristol-Myers Squibb | No | 2.5-5 mg qd | |
| Sitagliptin | Januvia | Merck | No | 25-100 mg qd | |
| Bile Acid Sequestrant | |||||
|
Colesevelam |
WelChol |
Daiichi Sankyo | No | 1875 mg bid | |
|
Dopamine Agonist |
|||||
|
Bromocriptine |
Parlodel |
Novartis | Yes | 0.25– 0.5 mg qd | |
| Bromocriptine | Cycloset | Santarus | (a quick release formulation) | 0.8-mg tabs - target range (1.6 - 4.8 mg) | |
Table 2. Fixed Combination Therapies Treat Type 2 Diabetes
|
Drug 1 |
Drug 2 |
Brand |
Manufacturer |
Generic Available |
Available Doses (mg Drug 1/mg Drug 2 |
|---|---|---|---|---|---|
|
Glyburide |
Metformin |
Glucovance |
Bristol-Myers Squibb |
yes |
1.25/250;2.5/500; 5/500 |
|
Glipizide |
Metformin |
Metaglip |
Bristol-Myers Squibb |
yes |
2.5/250; 2.5/500; 5/500 |
|
Glimepiride |
Pioglitazone |
Duetact |
Takeda |
no |
2/30; 4/30 |
|
Glimepiride |
Rosiglitazone |
Avandaryl |
GlaxoSmithKline |
no |
(restrected use in US) 1/4; 2/4; 4/4 |
| Sitagliptin | Metformin | Janumet | Merck | no | 50/500; 50/1000 |
| Saxagliptin | Metformin | Kombiglyze XR |
Bristol-Myers Squibb |
no | 5 mg /500; 5/1000; 2.5/1000 |
|
Pioglitazone |
Metformin |
ACTOSPlusMet |
Takeda |
no |
15/500; 15/850 |
|
repaglinide |
metformin | PrandiMet | Novo Nordisk | no | 1/500; 2/500 |
|
Rosiglitazone |
Metformin |
Avandamet |
GlaxoSmithKline |
no |
(restricted use in US) 1/500; 2/500; 4/500; 2/1000; 4/1000 |
The actions of sulfonylureas and meglitinides involve the stimulation of insulin secretion; metformin suppresses hepatic glucose production; the thiazolidinedione class targets peripheral tissue insulin resistance; and the α-glucosidase inhibitors inhibit complex carbohydrate breakdown in the gut. A summary of their primary sites of action is given is Figure 2. There are no studies directly comparing the efficacy of all the oral agents. Data from multiple studies are provided in Tables 3 and 4, which summarize comparative efficacies when these drugs are used as monotherapy and in combination. A cost comparison of the medications is given in Table 5. Since several comprehensive reviews have focused on this topic [8][9][10][11][12][13][14][15][16], the overall objective of this chapter is to provide a concise, comparative overview of the available oral treatments, and to highlight some emerging approaches.
Figure 2. Sites of action of the current and possible pharmacological therapies for the treatment of type 2 diabetes.

Table 3. Clinical Efficacy of Pharmacological Therapies to Treat Type 2 Diabetes When Used as Monotherapy or as Add On Treatment
|
↓Fasting Plasma Glucose | ||||||||
|---|---|---|---|---|---|---|---|---|
|
Agent Class |
(mg/dl) |
(mmol/l) |
↓HbA1C (%) |
Insulin |
Lipids |
Body Weight |
Major Side Effects |
|
|
Note: caution must be taken in comparing the results presented above. Head to head comparisons of these agents are limited. The groups studied were often different , with significantly different baseline HgA1c levels. There is a strong correlation between baseline HbA1c and the magnitude of effectiveness of these agents (i.e. ability to decrease HbA1c). Significantly greater reductions in both fasting plasma glucose and HbA1c were observed in groups with higher baseline HbA1c. For those patients whose HbA1c was <8.0%, the reduction from therapy was only 0.1-0.2% (see below) [17]
|
||||||||
|
Sulfonylureas |
60-70 |
3.3-3.9 |
0.8-2.0 |
Increase |
No effect |
Increase |
Hypoglycemia |
|
|
Meglitinides |
65-75 |
3.6-4.2 |
0.5-2.0 |
Increase |
No effect |
Increase |
Hypoglycemia |
|
|
Biguanide (Metformin) |
50-70 |
2.8-3.9 |
1.5-2.0 |
Decrease |
↓TG↓LDL ↑HDL |
Decrease |
GI disturbances; LA1 |
|
|
Thiazolidinediones Pioglitazone
Rosiglitazone |
60-80 |
3.3-4.3 |
1.4 -2.6 |
Decrease |
↓ TG, -LDL ↑ HDL; -TG, ↓ LDL,↑HDL |
Increase |
Fluid retention; decreased Hb, Congestive Heart Failure, fractures |
|
|
α-Glucosidase inhibitors |
25-30 |
1.9-2.2 |
0.7-1.0 |
No effect |
No effect |
No effect |
GI disturbances |
|
| DDP-4 inhibitor | 12-28 | 0.6.-1.5 | 0.5-0.8 | increase | No effect | no effedt | Risk of Pancreatitis (not proven) | |
| Bile Acid Sequestrant | 15 | .83 | 0.5 | No effect |
-TG, ↓ LDL,
-HDL |
No effect | esophageal obstruction, bowel obstruction, fecal impaction, dysphagia,pancreatitis, nausea, constipation | |
|
Dopamine Agonist |
0-18 | 0-1.0 | 0.1-0.6 | no effect | no effect | no effect | Nasal Stuffiness, Nausea, headache, constrictive pericarditis, neuroleptic malignant syndrome, hypotension | |
| GLP-1 agonist | 9-28 | 0.5-1.5 | .7-.9 | Increase | no effect | decrease | Nausea, constipation, Risk of pancratitis (not proven) | |
| Amylin | decrease | Nausea | ||||||
Table 4. Clinical Efficacy of Pharmacological Therapies to Treat Type 2 DiabetesWhen Used in Combination
|
Approved Combination |
Baseline HbA 1C(%) |
HbA 1C(%) a |
Reference |
|---|---|---|---|
|
aChange from baseline bTroglitazone (this TZD no longer available) was added to patients failing on SU and metformin. Abbreviations: AGI, α-glucosidase inhibitor; MEG, meglitinide; Nat, nateglinide; Pio, pioglitazone; Rep, repaglinide; Rosi, rosiglitazone; SU, sulfonylurea; Tro, troglitazone; TZD, thiazolidinedione |
|||
|
SU + Metformin |
8.8 |
-1.7 |
|
|
SU + Metformin |
10.1 |
-1.0 |
|
|
SU + Metformin |
11.0 |
-1.9 |
|
|
SU + Metformin |
12.3 |
-3.3 |
|
|
SU + Metformin |
10.8 |
-2.9 |
|
|
SU + TZD (Pio) |
≥8.0 |
-1.3 |
|
|
SU + TZD (Rosi) |
9.1 |
-0.9 |
|
|
SU + AGI (Acarbose) |
7.4 |
-1.0 |
|
|
SU + AGI (Acarbose) |
8.0 |
-0.9 |
|
|
SU + AGI (Acarbose) |
9.0 |
-1.1 |
|
|
SU + AGI (Miglitol) |
9.2 |
-0.5 |
|
|
Metformin + MEG (Rep) |
8.3 |
-1.4 |
|
|
Metformin + MEG (Nat) |
8.4 |
-1.5 |
|
|
Metformin + TZD (Pio) |
≥8.0 |
-0.8 |
|
|
Metformin + TZD (Rosi) |
8.9 |
-1.2 |
|
|
Metformin + AGI (Acarbose) |
7.9 |
-0.8 |
|
|
Metformin + AGI (Acarbose) |
8.5 |
-0.6 |
|
|
SU + Metformin + TZD (Tro) b |
9.6 |
-1.4 |
|
Table 5. Cost Comparison of Pharmacological Therapies to Treat Type 2 Diabetes
|
Drug Class |
Active Agent |
Brand Name |
Typical Daily Dose (mg) |
Monthly Cost 1($ US)
|
|---|---|---|---|---|
|
1Estimated cost from Drugstore.com. |
||||
|
Sulfonylureas |
Glyburide |
Diabeta, Micronase |
1.25-20 |
17-153 |
|
Sulfonylureas |
Glyburide |
generic |
1.25-20 |
13-26 |
|
Sulfonylureas |
Glyburide (micronized) |
Glynase |
1.5-12 |
24-109 |
|
Sulfonylureas |
Glyburide (micronized) |
generic |
1.5-12 |
5-12 |
|
Sulfonylureas |
Glipizide |
Glucotrol |
5-20 |
20-67 |
|
Sulfonylureas |
Glipizide |
generic |
5-20 |
6-12 |
|
Sulfonylureas |
Glipizide XL |
Glucotrol XL |
5-20 |
25-80 |
|
Sulfonylureas |
Glipizide XL |
generic |
5-20 |
19-40 |
|
Sulfonylureas |
Glimepiride |
Amaryl |
1-4 |
30-62 |
|
Sulfonylureas |
Glimepiride |
generic |
1-4 |
13-15 |
|
Meglitinides |
Repaglinide |
Prandin |
1.5-6 |
192 |
|
Meglitinides |
Nateglinide |
Starlix |
180-360 |
147-199 |
|
Biguanide |
Metformin |
Glucophage |
500-2000 |
35-141 |
|
Biguanide |
Metformin |
generic |
500-2000 |
6-32 |
|
Biguanide |
Metformin xr |
Glucophage XR |
500-2000 |
35-140 |
|
Biguanide |
Metformin xr |
generic |
500-2000 |
6-24 |
|
Thiazolidinediones |
Rosiglitazone |
Avandia |
4-8 |
130-240 |
|
Thiazolidinediones |
Pioglitazone |
Actos |
15-45 |
150-234 |
|
α-Glucosidase Inhibitors |
Acarbose |
Precose/ Glucobay |
150-300 |
88-102 |
|
α-Glucosidase Inhibitors |
Acarbose |
generic |
150-300 |
90-90 |
|
α-Glucosidase Inhibitors |
Miglitol |
Glyset |
150-300 |
88-100 |
| DDP-4 inhibitor | Sitagliptin | Januvia | 100 | 193 |
| DDP-4 inhibitor | Saxagliptin | Onglyza | 2.5-5 | 189 |
| Bile Acid Sequestrant | colesevelam | Welchol | 3750 | 224 |
|
Dopamine Agonist |
Bromocriptine | 0.25– 0.5 | 62-130 | |
| GLP-1 agonist | Exenatide | Byetta | 5-10 mcg SQ bid | 245-271 |
| GLP-1 agonist | Liraglutide | Victoza | 1.2-1.8 mg SQ qd | |
| Amylin | Pramlintide | Symlin | 15-120 mcg | 300 |
Treatment Goals
It is well established that, in poorly-controlled individuals with diabetes, both macrovascular and especially microvascular complications are increased [18][19]. Elevated post-prandial glucose is also associated with an increased risk for the development of macrovascular disease [20]. In the United Kingdom Prospective Diabetes Study (UKPDS) a reduction of HbA1c significantly decreased the risk for the development of microvascular complications in patients with type 2 diabetes [21]. Accordingly, recommendations for treatment goals have been proposed by several professional organizations. The American Diabetes Association recommends an HbA1c of less than 7% [22]. Since there was some evidence that increased risk for the develpment of cardiovascular disease begins at concentrations of HbA1c in the normal range, the American Association of Clinical Endocrinologists recommends an HbA1c of 6.5% or less [23]. There more ambitious goals may be tempered with the release of three large randomized prospective studies showing lowering glucose levels to HgA1c below 7% did not reduce the risk of cardiovascular disease. [24][25][26]
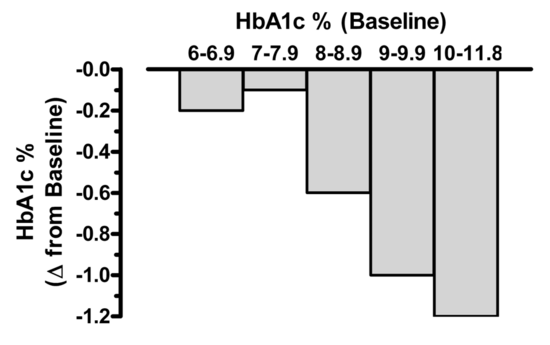
Though a majority of diabetic patients are being treated, many are unable to achieve the currently recommended goal of HbA1c <6.5% (AACE) or <7% (ADA). Bloomgarden et al reported results from a meta-regresion analysis of 61 clinical trials evaluating the efficacy of the five major classes of oral antihyperglycemic agents. His results indicate that there is a strong correlation between baseline HbA1c and the magnitude of effectiveness of these agents (i.e. ability to decrease HbA1c). Significantly greater reductions in both fasting plasma glucose and HbA1c were observed in groups with higher baseline HbA1c. For those patients whose HbA1c was <8.0%, the reduction from therapy was only 0.1-0.2% [27]. These results are presented graphically in Figure 3. Thus, expectations for the overall magnitude of effect from a given agent might be overly optimistic when treating patients whose baseline HbA1c is <7.5-8.0%. These observations certainly reinforce the need to use combination therapy (dual, triple, or even four agents) to achieve a recommended target for HbA1c. In addition, these results point out that comparing efficacy between drugs may be difficult when the HgA1c baseline is different in studies.
Figure 3. Relationship between baseline HbA 1cand the observed reduction in HbA 1cfrom baseline achieved following treatment with oral antihyperglycemic medication. Irrespective of drug class, the baseline glycemic control significantly influences the overall magnitude of efficacy. Data from Bloomgarden et al., Table 1 .
Sulfonylureas
Sulfonylureas, derived from sulfonic acid and urea, were initially developed in the 1950’s and have remained a cornerstone of therapy for type 2 diabetes [28]. The combination of their proven efficacy in most patients, low incidence of adverse events, and low cost has contributed to their success and continued use. They are frequently classified as either 1st generation or 2nd generation agents. First generation sulfonylureas (acetohexomide, chlorpropamide, tolazamide, and tolbutamide) possess a lower binding affinity for the ATP-sensitive potassium channel, their molecular target (vide infra), and thus require higher doses to achieve efficacy, increasing the potential for adverse events. In addition, the plasma half-life of 1st generation sulfonylureas is extended (e.g. 5-36 h) compared to the 2nd generation agents. Chlorpropamide was once the most commonly used oral agent, but now it is rarely prescribed. Unique complications associated with chlorpropamide are hyponatremia (SIADH) and an alcohol flushing reaction (disulfiram-Antibuse reaction). In addition, tolbutamide, acetohexamide and tolazamide generally require 2 or 3 doses per day and are rarely used.
More recently, 2nd generation sulfonylureas including glyburide (glibenclamide; , glipizide and glimepiride were introduced, and are now widely used. The 2nd generation sulfonylureas are much more potent compounds (~ 100-fold), possess a more rapid onset of action, and generally have shorter plasma half-lives and longer duration of action compared to the 1st generation agents.
Figure Structures of Glyburide, Glipizide and Glimepiride

Mechanism of Action
Sulfonylureas are insulin secretogogues, since they control blood glucose levels by directly stimulating first-phase insulin secretion in the pancreatic β cells. Through the concerted efforts of GLUT2 (the high Km glucose transporter) [29], glucokinase (the glucose sensor) [30], and glucose metabolism, these cells are responsible for sensing and secreting the appropriate amount of insulin in response to a glucose stimulus [31]. Mitochondrial glucose metabolism leads to ATP generation and increases the intracellular ratio of ATP/ADP, which results in the closure of the ATP-sensitive potassium channel (KATP; a 140 kDa membrane protein) on the plasma membrane. Closure of this channel depolarizes the membrane and triggers the opening of voltage-sensitive calcium channels, leading to the rapid influx of calcium. Increased intracellular calcium causes an alteration in the cytoskeleton, and stimulates translocation of insulin-containing secretory granules to the plasma membrane and the exocytotic release of insulin.
The KATP channel is comprised of two subunits, both of which are required for the channel to be functional. One subunit contains the cytoplasmic binding sites for both sulfonylureas and ATP, and is designated as the sulfonylurea receptor type 1 (SUR1). The other subunit is the potassium channel, which acts as the pore-forming subunit
[32]. Either an increase in the ATP/ADP ratio or ligand binding (by sulfonylureas, meglitinides) to SUR1 results in the closure of the KATP channel and insulin secretion. Studies comparing sulfonylureas and non-sulfonylurea insulin secretogogues have identified several distinct binding sites on the SUR1 that cause channel closure. Some sites exhibit high affinity for glyburide and other sulfonylureas, while other sites exhibit high affinity for the non-sulfonylurea secretogogues (vide infra).
Efficacy
The over clinical efficacy of sulfonylureas in patients with type 2 diabetes is related to the pre-treatment levels of fasting plasma glucose and HbA1C. The higher the fasting glucose level, the greater the effect will be. In patients with a pre-treatment glucose level of approximately 200 mg/dl (11.1 mmol/l), sulfonylureas typically will reduce glucose by 60-70 mg/dl (3.3-3.9 mmol/l) and HbA1C by 1.5-2% (Table 3). The most responsive patients are those who exhibit mild-to-moderate fasting hyperglycemia (<200-240 mg/dl; <12.2-13.3 mmol/l), along with adequate residual β-cell function (evidenced by elevated fasting C-peptide). When used at maximally effective doses, results from well-controlled clinical trials have not indicated a superiority of one 2nd generation sulfonylurea over another. Similarly, 2nd generation sulfonylureas exhibit similar clinical efficacy compared to the 1st generation agents. The principal advantage of glimepiride and Glucotrol XL compared to other agents is the once daily dosing regimen. Approximately 10-20% of patients will exhibit a poor initial response to sulfonylureas (primary failures). While these patients are typically those who have severe fasting hyperglycemia (>280 mg/dl; >15.5 mmol/l) and reduced fasting C-peptide levels, these tests are not specific enough to help decide on the usefulness of a sulfonylurea for an individual patient. In addition, treatment with sulfonylureas results in the eventual loss of therapeutic effectiveness (secondary failure) in the range of 3-10% per year [33].
The major side effect from sulfonylurea treatment is hypoglycemia. This side effect is really just an extension of the therapeutic objective. Mild hypoglycemic events occur in approximately 2-4% of patients and severe hypoglycemic reactions that require hospitalization occur at a frequency of 0.2-0.4 cases per 1000 patient-years of treatment [34]. In light of this, initiation of treatment with sulfonylureas should be at the lowest recommended dose. An additional undesirable effect of sulfonylurea therapy (as is also the case with insulin therapy) is weight gain. In the UKPDS, sulfonylurea treatment caused a net weight gain of 3 kg, which occurred during the first 3-4 years of treatment and then stabilized [35]. In contrast, weight gain in response to insulin therapy increased progressively for the duration of the study. As mentioned above, chlorpropamide is associated with hyponatremia (SIADH) and an alcohol flushing reaction (disulfiram-Antibuse reaction). All the agents can cause intrahepatic cholestasis. Rarely maculopapular or urticarial rashes occur.
In renal failure, the dose of the sulfonylurea agent will require adjustment based on glucose monitoring. The half-life of insulin is extended in renal failure and thus there is an increased risk for hypoglycemia. This risk is typically manifest with fasting hypoglycemia.
Meglitinides: Repaglinide and Nateglinide
The meglitinides are a novel class of non-sulfonylurea insulin secretogogues characterized by a very rapid onset and abbreviated duration of action. Repaglinide (Prandin®), a benzoic acid derivative introduced in 1998, was the first member of the meglitinide class. Nateglinide (Starlix®) is a derivative of the amino acid D-phenylalanine and was introduced to the market in 2001. Unlike sulfonylureas, repaglinide and nateglinide stimulate first-phase insulin release in a glucose-sensitive manner, theoretically reducing the risk of hypoglycemic events. The delivery of insulin as an early, transient ‘burst’ at the initiation of a meal affords several major physiological benefits (reviewed in [36][37]). These include rapidly suppressing hepatic glucose production and reducing the stimulus for additional insulin that would be required subsequently to dispose of a larger glucose load. Thus, the rapid onset/short duration stimulation of insulin release by meglitinides should enhance control of prandial hyperglycemia, while reducing the risk for post-absorptive hypoglycemia and limiting exposure to hyperinsulinemia.
Figure Structure of Nateglinide and Repaglinide

Mechanism of Action
Similar to sulfonylureas, meglitinides are insulin secretogogues, since they control blood glucose levels by directly stimulating first-phase insulin secretion in the pancreatic β cells. Receptor-binding studies performed in βTC-3 cells identified a high-affinity repaglinide (KD = 3.6 nmol/l) site having lower affinity for glyburide (14.4 nmol/l), and one high-affinity glyburide (25 nmol/l) site having lower affinity for repaglinide (550 nmol/l)(Figure 1.4) [38]. Repaglinide is approximately 5 times more potent than glyburide in stimulating insulin secretion. Unlike glyburide (and other sulfonylureas), repaglinide does not stimulate insulin secretion in vitro in the absence of glucose. Rather, it enhances glucose-stimulated insulin secretion especially at 180 mg/dl (10 mmol/l) glucose.
The mechanism of action of nateglinide (Figure 1.5) also involves the binding to and closure of the KATP channel resulting in membrane depolarization, an influx of calcium, and insulin exocytosis [39]. The kinetics of interaction of nateglinide with the KATP channel are distinct compared to both rapaglinide and sulfonylureas, and accounts for its rapid insulinotropic effects. The onset of action of nateglinide is similar to that of glyburide but three-fold more rapid than that of rapaglinide
[40]. When nateglinide is removed from the KATP channel, its effect is reversed twice as quickly as glyburide and five times more quickly than rapaglinide. Thus, nateglinide initiates a more rapid release of insulin that is shorter in duration compared to rapaglinide [41], despite having an in vivo pharmacokinetic profile that is similar [42][43].
Efficacy
The efficacy of rapaglinide, when used as a monotherapy, is similar to sulfonylureas [44]. Repaglinide treatment of patients with type 2 diabetes reduced fasting plasma glucose by approximately 60 mg/dl and HbA1C by 1.7% [45]. In a double-blind placebo-controlled study, rapaglinide had similar effects on lowering HbA1C (0.5-2%) and fasting plasma glucose (65-75 mg/dl; 3.6-4.2 mmol/l) compared to glyburide [46]. Repaglinide is also efficacious when used in combination with either metformin or troglitazone (a thiazolidinedione withdrawn from the market). In patients treated with rapaglinide and metformin, HbA1C was decreased from 8.3% to 6.9% and fasting plasma glucose by 40 mg/dl (2.2 mmol/l) [47]. Although lowered, the changes observed in subjects treated with either repaglinide or metformin monotherapy were not significant for HbA1C (0.4 and 0.3% decrease, respectively), or fasting plasma glucose (9 mg/dl (0.5 mmol/l) increase and 5.4 mg/dl (0.3 mmol/l) decrease, respectively). Significant increases in body weight occurred in the both repaglinide and combined therapy groups (2.4 ± 0.5 and 3.0 ± 0.5 kg, respectively).
The combination therapy of rapaglinide and troglitazone showed a significant reduction in mean HbA1C values (1.7%) that was greater than with either type of monotherapy
[48]. Repaglinide monotherapy resulted in a reduction of HbA1C values that was significantly greater than troglitazone (0.8% vs. 0.4%). In addition, combination therapy was more effective in reducing fasting plasma glucose (80 mg/dl) than either repaglinide (43 mg/dl) or troglitazone (46 mg/dl) monotherapies. Repaglinide is also efficacious when used in combination with other available thiazolidinediones, rosiglitazone (Avandia®) and pioglitazone (Actos)[49].
The efficacy of nateglinide when used as a monotherapy is similar to sulfonylureas and repaglinide (29;40). However, several therapeutically attractive features distinguish nateglinide from repaglinide and sulfonylureas. Nateglinide produces a more rapid post-prandial increase in insulin secretion, and its duration of response is shorter than that of glyburide [50][51]. Thus, the risk of post-absorptive hypoglycemia should be lower than with either sulfonylureas or rapaglinide, but this has not been demonstrated in studies to date.
The efficacy of nateglinide treatment has been evaluated alone and in combination with metformin in patients with type 2 diabetes [52]. In this randomized double-blind study, patients with an HbA1C level between 6.8 and 11.0% during a 4-week placebo run-in received 24 weeks’ treatment with 120 mg nateglinide before meals (n = 179), 500 mg metformin three times a day (n = 178), combination therapy (n = 172), or placebo (n = 172). At the study conclusion, HbA1C and fasting plasma glucose were significantly reduced from baseline with nateglinide [0.5% and 12.6 mg/dl (0.7 mmol/l), respectively] and metformin [0.8% and 28.8 mg/dl (1.6 mmol/l), respectively], but was increased with placebo [0.5% and 7.2 mg/dl (0.4 mmol/l), respectively]. Combination therapy was additive [HbA1C, 1.4% and glucose, 43.2 mg/dl (2.4 mmol/l)]. Although only preliminary data are available, nateglinide also appears effective when used in combination with thiazolidinediones [53][54].
In a direct comparison of Repaglinide and Nateglinide, the known pharmacodynamic differences in the drugs are evident on the clinical outcomes. [55] The longer acting Repaglinide has significant effects on fasting glucose levels while Nateglinide does not. (figure 3a) These clinical findings are important and can be incorporated into clinical decision making. For example, if the main issue for the patient is postprandial hyperglycemia, and fasting glucoses are near normal, an agent that has limited effect on the fasting glucose would be beneficial.

Figure 3a. Comparison of Repaglinide and Nateglinide [56]
Side Effects
In 1-year trials, the most common adverse events reported in repaglinide recipients (n = 1,228) were hypoglycemia (16%), upper respiratory tract infection (10%), rhinitis (7%), bronchitis (6%) and headache (9%). The overall incidence of hypoglycemia was similar to that recorded in patients receiving glibenclamide, glipizide or gliclazide (18%; n = 597); however, the incidence of serious hypoglycemia appears to be slightly higher in sulphonylurea recipients. Weight gain does occur in patients treated with repaglinide, but the magnitude is significantly less compared to treatment with glyburide. In patients switched from sulfonylureas to repaglinide, no weight gain was observed; in drug-naïve patients, repaglinide-treatment increased body weight by approximately 3% (6lb) [57][58].
The clinical trials of nateglinide carried out to date have found the drug to be safe and well tolerated. Dosage regimens ranging from 60 to 240 mg have been evaluated. The most common adverse effects are nausea, diarrhea, dizziness, and lightheadedness. The incidence of mild hypoglycemia is lower with nateglinide than for rapaglinide and no reports of severe hypoglycemia, consistent with the mechanism of action of nateglinide. In the clinical studies carried out to date, there have been no reports of any increase body weight gain.
Metformin
Metformin (dimethlybiguanide; Glucophage®) is a synthetic analog of the natural product guanidine, whose history as a treatment for diabetes can be traced to medieval times [59]. Metformin has surpassed the sulfonylureas as the most prescribed oral agent for type 2 diabetes in the US. In the major European markets, metformin is the second most prescribed agent after glyburide [60]. The widespread acceptance of metformin evolved after the realization that lactic acidosis was not a major problem in individuals with normal renal function. Phenformin, a structurally similar analog of metformin, was previously withdrawn from the market in many countries due its propensity to induce lactic acidosis. Metformin is recommended as a first-line therapy in newly diagnosed individuals, and can be used in combination with an insulin secretagogue (sulfonylurea or meglitinide), thiazolidinedione, α-glucosidase inhibitor, exenatide, DPP-4 inhibitor or insulin [61][62][63]. When used as a monotherapy, metformin decreases HbA1c by 1.5-2.0%, increases insulin sensitivity, does not promote weight gain, and has an acceptable side effect profile.
Figure Structure of Metformin

Mechanism of Action
An elevated rate of basal hepatic glucose output is the primary determinant of elevated fasting blood glucose levels in patients with type 2 diabetes [64]. The primary effect of metformin (Figure 1.6) is the suppression of basal hepatic glucose production, thereby reducing fasting plasma glucose [65][66][67]. Despite the large number of studies both in vitro and in humans that have established this mode of action, the molecular target of metformin action still awaits identification. Metformin does not stimulate insulin secretion; in contrast, metformin reduces fasting plasma insulin and improves whole-body insulin-stimulated glucose metabolism (insulin sensitivity) [68][69]. While it is possible that the beneficial effect of metformin on insulin sensitivity is mediated directly, a more likely explanation is that it is secondary to a reduction in hyperglycemia, triglycerides, and free fatty acids.
Recent in vitro and in vivo evidence has shown that metformin activates the AMP-activated protein kinase (AMPK) [70], a major cellular regulator of lipid and glucose metabolism [71]. As a result, acetyl-CoA carboxylase activity was reduced, fatty acid oxidation induced (due to decreased malonyl-CoA), and the expression of lipogenic enzymes along with SREBP-1, a key lipogenic transcription factor, suppressed [72]. The use of a novel AMPK inhibitor indicated that AMPK activation was required for the inhibitory effect of metformin on glucose production in hepatocytes. In isolated rat skeletal muscles, metformin stimulated glucose uptake coincident with AMPK activation. These results are intriguing in that they implicate the activation of AMPK as a unified explanation for the beneficial effects of metformin.
Efficacy
A large number of well-controlled clinical studies have established that metformin monotherapy consistently reduces fasting plasma glucose by 60-70 mg/dl (3.3-3.9 mmol/l) and HbA1c by 1.5-2.0% [73][74][75]. Thus, the efficacy of metformin is in the same range as that observed for monotherapy treatment with sulfonylureas. Similar to the sulfonylurea treatment, the overall magnitude of response to metformin is directly related to the starting fasting plasma glucose concentration. Metformin also reduces fasting plasma insulin, triglycerides, and free fatty acids [76]. Unlike sulfonylurea treatment, metformin monotherapy is not associated with weight gain and even promotes a modest weight loss. When used in combination with other oral agents or insulin, weight gain is not observed. Metformin is the only oral agent that when used as a monotherapy has been reported to reduce the risk of developing macrovascular complications [77].
Historically, when patients with type 2 diabetes in the US had mean HbA1c of approximately 10% and fasting plasma glucose approximately 200-240 mg/dl, in patients of this sort, monotherapy with either metformin or a sulfonylurea generally decreased plasma glucose to <140 mg/dl (<7.8 mmol/l) in about 25-30% of patients. In contrast, combined metformin and sulfonylurea therapy increased the percentage of patients who achieve this level of control to approximately 60-70% [78]. When added to a sulfonylurea, the effects of both agents are additive, consistent with their different mechanisms of action. Interestingly, in patients that no longer responded to sulfonylurea treatment (secondary failures) and were removed from treatment, addition of metformin had minimal effects [79]. Thus, in these patients, sulfonylurea treatment was still eliciting an effect, emphasizing the need to continue treatment with both agents.
The additive effect of metformin and sulfonylurea therapy is illustrated in Figure 4. As shown, there was no change in glucose levels when the sulfonylurea was changed to metformin. However, when the metformin was added, there was a dramatic decrease in plasma glucose. In fact, this pattern is seen in virtually all studies comparing two oral agents. This concept is illustrated in Figure 5. When a patient is on drug A and they are changed to drug B, no improvement in glucose control will be seen. However, if drug B is added to drug A, there is an improvement. This concept can often be extended by the addition of drug C, drug D, etc.
Figure 4. Effect of metformin on fasting plasma glucose when given as add-on therapy to glyburide. Data show the effects on fasting plasma glucose (mean change from baseline) in patients with type 2 diabetes continuing on glyburide therapy, switched to metformin, or given metformin as add-on therapy to glyburide. Data from [80].

Figure 5. Efficacy when oral agents are used as add-on therapy. When a patient is on drug A and they are changed to drug B, C, or D, often no improvement in glucose control will be seen. However, if drug B is added to drug A, there is an improvement. This concept can often be extended by the addition of drug C, drug D.

Benefits Beyond Glucose Control
Cardiovascular Disease
In a retrospective study on the effect of metformin-containing antidiabetic regimens on all-cause mortality in veterans with Type 2 Diabetes Mellitus, there was a decreased hazard ratio for all cause mortality for patients taking metformin whether they were also on other oral agents (0.77 p<0.01 )or on insulin (0.62 p<0.04). ([81]) In the United Kingdom Prospective Diabetes Study, 10 years after the study was completed, if the subjects had been on treatment regimens that included metformin there was a reduction in any diabetes-related end point (21%, P=0.01) myocardial infarction (33%, P=0.005) and death from any cause (27%, P=0.002). ([82]) In the REACH Registry (Reduction of Atherothrombosis for Continued Health) 19,691 patients with diabetes and established atherothrombosis were assessed for the effect of metformin use in circumstances when the medication would historically be contraindicated. They found the mortality rates were 6.3% (95% confidence interval [CI], 5.2%-7.4%) with metformin and 9.8% 8.4%-11.2%) without metformin; the adjusted hazard ratio (HR) was 0.76 (0.65-0.89; P<.001). Association with lower mortality was consistent among subgroups, noticeably in patients with a history of congestive heart failure (HR, 0.69; 95% CI, 0.54-0.90; P=.006), patients older than 65 years (0.77; 0.62-0.95; P=.02), and patients with an estimated creatinine clearance of 30 to 60 mL/min/1.73 m2 (0.64; 95% CI, 0.48-0.86; P=.003) (to convert creatinine clearance to mL/s/m2, multiply by 0.0167). ([83])
Side Effects and Contraindications
The most common side effects of metformin are gastrointestinal disturbances (abdominal discomfort, diarrhea), which occur in approximately 20-30% of patients. These effects are generally transient, and can be minimized or avoided by careful dose titration. The incidence of lactic acidosis is rare and occurs with a frequency of 3 cases per 100,000 patient-years. It appears that •Metformin probably not as unsafe as previously thought. 25% of users have relative contraindication and yet lactic acidosis remains rare.[84] In addition, the patients who do develop lactic acidosis usually have acute renal failure and previously had normal renal function.[85]
However, metformin is contraindicated in patients with impaired renal function and liver disease.
The risk of lactic acidosis can be minimized when the following are considered:
-
Withhold in conditions predisposing to renal insufficiency and/or hypoxia
-
CV collapse
-
Acute MI or acute CHF
-
Severe infection
-
Use of iodinated contrast material
-
Major surgical procedures
-
-
Officially, Metformin should not be prescribed for patients with:
-
Renal dysfunction [e.g. Scr >1.5 mg/dl (males), >1.4 mg/dl (females) or abnormal CrCl)
-
Liver dysfunction
-
History of alcohol abuse/binge drinking
-
Acute or chronic metabolic acidosis
-
With the introduction of the eGFR (estimated glomerular filtration rate) the question of a cutoff value for using this test for discontinuing metormin has been raised. An eGFR of 36 ml/min per 1.73m2 would be somewhat neutral to current use. [86] Use of a novel assay for metformin levels has confirmed that metformin levels are not increased with eGFR levels as low as 30 ml/min per 1.73m2 [87] .
Vitamin B12 deficiency: Both short and long term use of metformin has been found to decrease vitamin B12 levels. (decreased 4.2-47%). [88][89][90][91][92][93] Metformin is thought to induce malabsorption of vitamin B12 and intrinsic factor in the ileum, an effect that can be reversed by increased calcium intake. [94][95][96] Anemia may be minimal to severe (RR author observations). However, metformin associated vitamin B12 deficiency may present without anemia and only as a peripheral neuropathy, possibly being misdiagnosed as diabetic neuropathy. It has been speculated that exhaustion of vitamin B12 stores usually occurs after twelve to fifteen years of absolute and as metformin has been available in the United States for approximately fifteen years these clinical findings may now be coming to light. [97]
Thiazolidinediones: Pioglitazone and Rosiglitazone
Pioglitazone (Actos®) and rosiglitazone (Avandia®) are members of the thiazolidinedione class of insulin sensitizing compounds originally discovered and characterized for their glucose- and lipid-lowering activity [98][99]. These compounds decrease insulin resistance and enhance the biological response to endogenously produced insulin, as well as insulin administered by injection [100][101][102]. Until September 23, 2010, each drug was approved for use in the US as monotherapy, which results in a significant reduction in fasting plasma glucose by 60-80 mg/dl and in HbA1c by 1.4-2.6% [103]. In addition, pioglitazone is approved for use in combination with insulin, metformin, or a sulfonylurea, and rosiglitazone is approved for use in combination with metformin or a sulfonylurea. Troglitazone (Rezulin®), another member of this chemical class, was withdrawn from US, European, and Japanese markets in 2000 due to idiosyncratic hepatic reaction leading to hepatic failure and death in some patients. Although there are some data from animal studies suggesting that hepatic toxicity might be characteristic of the thiazolidinedione class [104], current clinical evidence indicates that pioglitazone and rosiglitazone treatment do not result in liver toxicity [105][106][107][108]. As of September 2010, as a result of cardiovascular concerns (see below) Rosiglitazone was removed from the European market and use in the United States was restricted by the FDA. Use of rosiglitazone was restricted to patients who could not use any other medication. In addition, the patient must be informed about the potential cardiovascular risks. [109]
Figure Structures of Rosiglitazone and Pioglitazone

Mechanism of Action
The primary effects of pioglitazone (Figure 1.7) and rosiglitazone (Figure 1.8) are the reduction of insulin resistance and improvement of insulin sensitivity, resulting in a reduction of fasting plasma glucose, insulin, and free fatty acids [110][111][112][113][114]. Unlike other existing anti-diabetic medications that possess a very rapid onset of activity, pioglitazone and rosiglitazone exhibit a characteristic delay from 4-12 weeks in the onset of their therapeutic benefits. This is likely related to their mode of action, which involves the regulation of gene expression [115][116][117]. Pioglitazone and rosiglitazone are selective agonists for the peroxisome proliferator-activated receptor γ (PPARγ), a member of the superfamily of nuclear hormone receptors that function as ligand-activated transcription factors [118][119]. The PPAR family, which also includes PPARα and PPARδ, functions as receptors for fatty acids and their metabolites (e.g. eiconasoids) and, consequently, plays a critical physiological role the regulation of glucose, fatty acid, and cholesterol metabolism. PPARα is the receptor for the fibrate class of lipid-lowering drugs, and PPARδ is involved in the regulation of high-density lipoprotein metabolism [120][121].
The structure-activity relationship between PPARγ agonists and their glucose lowering activity in vivo has been established (72). In the absence of ligand, PPARs bind as heterodimers with the 9-cis retinoic acid receptor (RXR) and a multi-component co-repressor complex to a specific response element (PPRE) within the promoter region of their target genes [122][123]. Once PPAR is activated by ligand, the co-repressor complex dissociates allowing the PPAR-RXR heterodimer to associate with a multi-component co-activator complex resulting in an increased rate of gene transcription. The target genes of PPARγ include those involved in the regulation of lipid and carbohydrate metabolism [124][125][126].
It does not appear that rosiglitazone and pioglitazone improve insulin sensitivity and glucose disposal by direct effects on either liver or muscle. PPARγ is expressed chiefly in adipose tissue, and its expression in liver and skeletal muscle is low [127][128]. Thus, it is more likely that the primary effects of these drugs are on adipose tissue, followed by secondary benefits on other target tissues of insulin [129]. The ability of rosiglitazone and pioglitazone to decrease circulating free fatty acids could lead to an improvement in insulin action in the periphery [130][131][132][133]. More recently, PPARγ agonists have been reported to increase the expression and circulating level of adiponectin (Acrp30), an adipocyte-derived protein with insulin sensitizing activity [134][135], in diabetic rodents [136] and in patients with type 2 diabetes [137]. Recognition of the importance of PPARγ in the overall regulation of carbohydrate and lipid metabolism along with growing realization that the adipocyte is an endocrine organ [138][139] suggests that investigations in this area will intensify, and perhaps uncover additional mechanisms by which rosiglitazone and pioglitazone improve insulin sensitivity and glucose disposal.
Efficacy
Rosiglitazone
The clinical efficacy of rosiglitazone and pioglitazone therapy has been extensively reviewed [140][141][142][143][144][145][146][147]. Two 26-week, double blind, placebo-controlled clinical studies have established that rosiglitazone monotherapy reduces fasting plasma glucose and HbA1c in patients with type 2 diabetes [148][149]. Treatment with rosiglitazone at 4 mg/day reduced fasting plasma glucose by approximately 30-45 mg/dl and HbA1c by 0.8-1.0%, compared with placebo. Treatment with rosiglitazone at 8 mg/day reduced fasting plasma glucose by approximately 45-65 mg/dl and HbA1c by 1.1-1.5%, compared with placebo (10;57;87). In patients with type 2 diabetes inadequately controlled with metformin, rosiglitazone produced a significant reduction in HbA1c compared to metformin treatment alone (94;95). In another study in which rosiglitazone was directly compared to a maximum stable dose of glyburide (15 mg/day), rosiglitazone reduced fasting plasma glucose by 25 mg/dl at 4 mg/day, and 40 mg/dl at 8 mg/day [150]. The reduction in HbA1c was 0.7% for glyburide, 0.3% for rosiglitazone at 4 mg/day, and 0.5% for rosiglitazone at 8 mg/day.
Pioglitazone
Double blind, placebo-controlled studies with pioglitazone as monotherapy, have established that this agent reduces fasting plasma glucose HbA1c in patients with type 2 diabetes [151][152][153][154]. Patients treated with 15, 30, or 45 mg (once daily) pioglitazone had significant mean decreases in HbA1c (range -1.00 to -1.60% difference from placebo) and fasting plasma glucose (-39.1 to -65.3 mg/dl difference from placebo). The decreases in fasting plasma glucose were observed as early as the second week of therapy; maximal decreases occurred after 10-14 weeks and were maintained until the end of therapy (week 26). There was no evidence of drug-induced hepatotoxicity, or elevated alanine aminotransferase activity.
The efficacy and tolerability of pioglitazone in combination with metformin has been assessed in patients with type 2 diabetes mellitus [155]. Patients receiving pioglitazone (30 mg) + metformin had statistically significant mean decreases in HbA1c (-0.83%) and fasting plasma glucose levels (-37.7 mg/dl) compared with placebo + metformin. Decreases in fasting plasma glucose levels occurred as early as the fourth week of therapy, the first time point at which fasting plasma glucose was measured. The pioglitazone + metformin group had significant mean percentage changes in levels of triglycerides (-18.2%) and high-density lipoprotein cholesterol (+8.7%) compared with placebo + metformin. Mean percentage increases were noted in low-density lipoprotein cholesterol levels (7.7%, pioglitazone + metformin; 11.9%, placebo + metformin) and total cholesterol (4.1%, pioglitazone + metformin; 1.1%, placebo + metformin), with no significant differences between groups. In the extension study, patients treated with open-label pioglitazone + metformin for 72 weeks had mean changes from baseline of -1.36% in HbA1c and -63.0 mg/dl in fasting plasma glucose. In this study, there was no evidence of drug-induced hepatotoxicity.
The efficacy and tolerability of pioglitazone in combination with a sulfonylurea has been also assessed in patients with type 2 diabetes mellitus [156]. Patients receiving pioglitazone (30 mg) + metformin had statistically significant mean decreases in HbA1c (-0.83%) and fasting plasma glucose levels (-37.7 mg/dl) compared with placebo + metformin. Decreases in fasting plasma glucose levels occurred as early as the fourth week of therapy, the first time point at which fasting plasma glucose was measured. The pioglitazone + metformin group had significant mean percentage changes in levels of triglycerides (-18.2%) and high-density lipoprotein cholesterol (+8.7%) compared with placebo + metformin. Mean percentage increases were noted in low-density lipoprotein cholesterol levels (7.7%, pioglitazone + metformin; 11.9%, placebo + metformin) and total cholesterol (4.1%, pioglitazone + metformin; 1.1%, placebo + metformin), with no significant differences between groups. In the extension study, patients treated with open-label pioglitazone + metformin for 72 weeks had mean changes from baseline of -1.36% in HbA1c and -63.0 mg/dl in fasting plasma glucose. In this study, there was no evidence of drug-induced hepatotoxicity.
The efficacy and tolerability of pioglitazone in combination with a sulfonylurea has been also assessed in patients with type 2 diabetes mellitus. [157][158] and others [159]. Twenty-three diabetic patients treated with a stable dose of sulfonylurea were randomly assigned to receive either placebo (n = 11) or pioglitazone (45 mg/day) (n = 12) for 16 weeks [160]. Before and after 16 weeks of treatment, all subjects received a 75-g oral glucose tolerance test (OGTT) and peripheral insulin sensitivity was measured with a two-step euglycemic insulin clamp. After 16 weeks pioglitazone treatment significantly decreased fasting plasma glucose, mean plasma glucose during OGTT, and HbA1c without changing fasting or glucose-stimulated insulin/C-peptide concentrations. Fasting plasma free fatty acid (FFA) and mean plasma FFA during OGTT also decreased significantly after pioglitazone treatment. Pioglitazone treatment significantly decreased endogenous glucose production, whereas insulin-stimulated total and non-oxidative glucose disposal was significantly increased indicative of an improvement in hepatic and peripheral (muscle) tissue sensitivity to insulin. Subsequent work has indicated that pioglitazone at doses of 30 and 45 mg/day (but not at doses of 7.5 or 15 mg/day) improves β-cell function along with whole-body insulin sensitivity [161].
Side Effects
The major side effects of this class of drugs are edema, weight gain, decreased hematocrit and hemoglobin, and elevated (but reversible) alanine aminotransferase activity. Unlike troglitazone, idiosyncratic hepatic reaction does not appear to be a problem with rosiglitazone or pioglitazone. The edema ranges from bothersome trace to anasarca. The mechanism of the edema production is not known. Clinically, diuretics have minimal effect on reducing the edema, though spironolactone may have more benefit than other diuretics. [162] While there are no published studies on this subject, it does appear that the edema is dose dependent. Weight gain may be a modest 2-4 pounds to >20 lbs [163]. Due to their mechanism of action, the risk of hypoglycemia with rosiglitazone or pioglitazone monotherapy is low. Mild to moderate hypoglycemia has been reported during combination therapy with sulfonylureas or insulin [164][165].
Cardiovascular Disease
A general listing of the cardiovascular effectsof thiazolidinediones is shown below in Table .
Table Effects of Thiazolidinediones (pioglitazone/rosiglitazone) on Cardiovascular Risk Factors
| Lipid profile |
↑ LDL cholesterol particle size ↑ Lipoprotein a ↑ HDL cholesterol ↓/-- LDL/HDL ratio ↓/↑ Triglycerides |
| Coagulation and fibrinolysis |
↓ Fibrinogen ↓ Platelet aggregation |
|
Hemodynamic and vascular parameters |
↑ Intravascular volume ↓Blood pressure ↓ Intima-media thickness ↑ Endothelial function ↓ Urine albumin excretion |
| Inflamatory Markers |
↓ C-reactive protein ↓ Adiponectin ↓ Tumor necrosis factor-α |
In a meta-analysis by Nissen and Wolski,[166] published literature and clinical trial registries were searched for cardiovascular end points such as MI and death from cardiovascular causes. Data were combined by means of a fixed-effect model. Forty-two trials were selected. In the rosiglitazone group, as compared with the control group, the odds ratio (OR) for MI was 1.43 (95% CI, 1.03-1.98; P = .03), and the OR for death from cardiovascular causes was 1.64 (95% CI, 0.98-2.74; P = .06). The authors concluded that rosiglitazone was associated with a significant increase in the risk of MI and with an increased risk of death from cardiovascular causes that had borderline significance. There were significant limitations to the study including lack of access to original data, which would have enabled time-to-event analysis, no confirmation of events, many studies had only zero or 1 report, and these trials were not designed to capture or adjudicate events. With correction of some of these limitations, another Meta analysis failed to show any statistical increased risk. [167]. Since that time there have been multiple meta analyses looking at variations of the same data with variable results.
A meta analysis of cardiovascular events using patient-level data from randomized trials comparing pioglitazone with a range of alternative regimens [168] determined that death, MI, or stroke occurred in 375 of 8,554 patients (4.4%) receiving pioglitazone and 450 of 7,896 patients (5.7%) receiving control therapy (HR, 0.82; 95% CI, 0.72-0.94; P = .005). The authors concluded that treatment with pioglitazone was associated with a significantly lower risk of death, MI, or stroke compared with any of the alternative regimens. Serious heart failure was increased in patients on pioglitazone, although without an associated increase in mortality (HR, 1.41; 95% CI, 1.14-1.76; P = .002).
There have been two prospective, randomized studies specifically looking at cardiovascular outcome and thiazolidinediones. The study looking at pioglitazone (PROactive study) failed to show a significant benefit of treatment on the primary composite end points (hazard ratio [HR], 0.90; 95% confidence interval [CI], 0.80-1.02; P = .095).[169] However, pioglitazone reduced risk for the main secondary end points, including death from any cause, nonfatal MI, and stroke (HR, 0.84; 95% CI, 0.72-0.98; P = .027). Addition of rosiglitazone to glucose-lowering therapy (RECORD Study) was confirmed to increase the risk of heart failure, but the data remained inconclusive about any possible effect on myocardial infarction. Rosiglitazone did not increase the risk of overall cardiovascular morbidity or mortality compared with standard glucose-lowering drugs. [170]
Fractures
In 2006, an increased risk of fractures was discovered in subjects receiving rosigliatzone participating in the ADOPT Study (A Diabetes Outcome and Progression Trial). [171] Since then there have been multiple reports on the association of thizolidenediones and fractures with a Meta-analysis of 10 randomized controlled trials (13,715 participants) and from 2 observational studies (31679 participants) showed a significant increased risk of fractures in women (OR 2.23, 95%cl 1.65-3.01; p<.001), but not in men. [172] There has been no explanation for the sex difference, but one may speculate that the age of the men in these studies is generally younger than one expects to see significant risk of fractures. Several studies have shown that bone mineral density declines with use of these medications. [173][174]
α-Glucosidase Inhibitors
Acarbose (Precose®, Glucobay®) and miglitol (Glycet®) are members of the α-glucosidase inhibitor class of oral anti-hyperglycemic compounds that function by blocking the enzymatic degradation of complex carbohydrates in the small intestine [175][176]. These compounds lower post-prandial glucose and improve glycemic control without increasing the risk for weight gain or hypoglycemia. Each drug is approved for use in the US as monotherapy, which results in a significant reduction in fasting plasma glucose by 25-30 mg/dl, post-prandial glucose by 40-50 mg/dl, and HbA1c by 0.7-1.0% [177][178][179]. In addition, acarbose is approved for use in combination with insulin, metformin, or a sulfonylurea, and miglitol is approved for use in combination with a sulfonylurea. The effects of these compounds on glycemic control are additive when used in combination, presumably since their mechanism of action is different. Neither drug is approved in the US for use in combination with a meglitinide or thiazolidinedione. α-glucosidase inhibitors are suitable approaches for patients that have mild to moderate hyperglycemia, or those patients prone to hypoglycemia or at risk for lactic acidosis.

Mechanism of Action
α-Glucosidase inhibitors are competitive, reversible inhibitors of pancreatic α-amylase and membrane-bound intestinal α-glucosidase hydrolase enzymes. Acarbose, the first α-glucosidase inhibitor discovered, is a nitrogen-containing pseudotetrasaccharide (Figure 1.9), while miglitol is a synthetic analog of 1-deoxynojirimycin (Figure 1.10). The mechanism of action of these inhibitors is similar but not identical. They bind competitively to the oligosaccharide binding site of the α-glucosidase enzymes, thereby preventing enzymatic hydrolysis. Acarbose binding affinity for the α-glucosidase enzymes is: glycoamylase > sucrase > maltase > dextranase [180][181]. Acarbose has little affinity for isomaltase and no affinity for the β-glucosidase enzymes, such as lactase [182]. Miglitol is a more potent inhibitor of sucrase and maltase that acarbose, has no effect on α-amylase, but does inhibit intestinal isomaltose [183].
Clinical trials conducted to date have established that the antihyperglycemic effectiveness of acarbose and miglitol is less than 50% than that of either sulfonylureas or metformin. When used as monotherapy, acarbose primarily affects post-prandial glucose levels, which is reduced by 40-50 mg/dl after meal [184][185][186][187][188][189]. In most studies, α-glucosidase inhibitors have no significant effects on either fasting insulin or whole body insulin sensitivity in patients with type 2 diabetes. However, there is some evidence that acarbose and voglibose, a structural analog of miglitol in clinical development in Japan, reduces post-prandial hyperinsulinemia in glucose intolerant individuals [190][191]. Some but not all studies have reported small decreases in fasting or post-prandial triglycerides [192]. Since the mechanism of action of α-glucosidase inhibitors is different from other oral agents, their effects on glycemic control are additive when used in combination. As summarized by Lebovitz [193], addition of acarbose to sulfonylurea therapy decreases HbA1c by 0.85%; addition of acarbose to metformin therapy decreases HbA1c by 0.73%; and addition of acarbose to insulin therapy decreases HbA1c by 0.54%. As for monotherapy, the predominant improvement is on post-prandial hyperglycemia. Treatment with α-glucosidase inhibitors appears to have a lower rate of secondary failures characteristic of sulfonylurea and metformin therapy.
Side Effects
The major side effects of the α-glucosidase inhibitors are related to gastrointestinal disturbances. These occur in approximately 25-30% of diabetic patients, and include flatulence, diarrhea, bloating, and abdominal discomfort. These side effects can often be minimized by careful dose titration, and sometimes diminish with time. Acarbose is contraindicated in patients with inflammatory bowel disease, cirrhosis, or elevated plasma creatinine (>177 μmol/l). This class of drugs is associated with dose-dependent hepatotoxicity, and serum transaminase levels require monitoring for patients receiving high doses (>200 mg three times daily). Transaminase elevations, which are often asymptomatic, are reversible upon cessation of treatment. Hypoglycemia does not occur in patients on α-glucosidase inhibitor monotherapy. If hypoglycemia occurs while a patient is taking an α-glucosidase inhibitor simultaneously with a sulfonylurea, insulin or a meglitinide, the recommended action is oral administration of pure glucose, dextrose or milk.
INCRETINS
The incretin effect, defined by a significantly greater insulin stimulatory effect evoked after an oral glucose load than that evoked from an intravenous glucose infusion when plasma glucose concentrations are matched, was first described in the 1960’s.[194] This effect is shown below in figure __.
Figure The difference between oral and intravenous glucose on insulin release. There is a significant
increase in insulin with oral vs intravenous glucose - the "incretin effect." [195]

Although other hormones may take part in the incretin effect, the majority of the effect is thought to be due to glucose-dependent insulinotropic peptide (GIP) and glucagon like peptide-1 (GLP-1).[196][197][198][199][200] The physiological importance of GIP and GLP-1 in overall glucose metabolism has been demonstrated using receptor-knockout animal models,[201][202][203][204]as well as with the use of receptor antagonists.[205][206][207] Patients with type 2 diabetes have a significant reduction of the incretin effect, implying that these patients either have decreased concentration of the incretin hormones, or a resistance to their effects. GLP-1 concentrations are reduced in patients with type 2 diabetes in response to a meal, while GIP concentrations are either normal or increased, suggesting a resistance to the actions of GIP thus making GLP-1 a more logical target for therapeutic intervention.[208][209]
Brown and colleagues isolated the first incretin from cholesystokinin in 1971, and named it gastric inhibitory peptide (GIP). [210][211] After demonstrating its insulinotrophic properties, Dupre renamed the peptide glucose-dependent insulinotropic peptide (GIP), thus preserving the acronym.[212] Within minutes after ingestion of food, GIP is secreted from the K-cells located in the proximal region of the jejunum.[213][214][215] GIP helps maintain normal glucose homeostasis in rodent models, and has an insulinotropic effect in response to hyperglycemia in both animals and humans.[216][217][218] However, GIP does not inhibit glucagon secretion, and in fact may stimulate it during euglycemic states, and has no effect on gastric emptying.[219][220][221] Furthermore GIP concentrations in patients with type 2 diabetes are either normal, or slightly increased in response to a meal.[222][223] In patients with type 2 diabetes, GIP infusion has not been able to reduce plasma glucose concentrations, due to a lack of amplification of late phase insulin response to glucose, compared to GLP-1.[224] Thus, GIP has not been considered a suitable candidate for therapeutic development for the treatment of type 2 diabetes.[225]
GLP-1 is cleaved from the proglucagon molecule by the gut specific prohormone convertase enzymes 1 and 3. [226][227][228] Two forms of GLP-1 are secreted, GLP-1(7-37) and GLP-1(7-36)amide. [229] The majority of circulating active GLP-1 appears to be GLP-1(7-36)amide. [230][231] GLP-1 is stored in the L-cells of the ileum and colon, and released at mealtime in response to neurohormonal signals and the presence of food in the gut. [232][233][234][235] GLP-1 exerts its effect on postprandial glucose concentrations through several mechanisms, including enhancing insulin secretion and suppressing postprandial glucagon secretion in a glucose-dependent manner. [236][237] In addition GLP-1 slows the rate of gastric emptying, which is often paradoxically accelerated in patients with diabetes. [238][239] GLP-1 also acts as a postprandial satiety signal through neurohormonal networks that signal the brain to suppress appetite and food intake. [240][241][242][243] Furthermore, GLP-1 also has direct effects on the β-cells, as shown in studies done in animal models and cell lines, promoting cell proliferation and neogenesis, while preventing β-cell apoptosis. [244] Additionally, GLP-1 can promote transformation of noninsulin-producing pancreatic cells into cells capable of synthesizing and secreting insulin. [245][246][247][248]
Figure

Figure

GLP-1 reportedly has effects on the liver, skeletal muscle as well as the adipose tissue, resulting in increased glycogen synthesis and peripheral insulin-stimulated glucose uptake. [249][250][251] However, this effect is considered controversial, as there have been contradictory observations as well. [252][253] GLP-1 receptors are also located in the heart, and have been associated with cardiovascular response to stress. [254][255][256][257] Unfortunately in spite of all the potentially beneficial effects of GLP-1 on glucose homeostasis, the therapeutic potential of naturally occurring GLP-1 is limited, due to its extremely short half-life of less than 2 minutes largely due to the degradation by the enzyme dipeptidyl peptidase IV (DPP-IV). [258][259][260][261]
Administration of exogenous GLP-1, as a continuous subcutaneous or intravenous infusion, has been shown to increase insulin secretion, and normalize both fasting and postprandial blood glucose concentrations. As shown in Figure below, an infusion of GLP-1 in a hyperlgycemic Type 2 paient will reduce the glucose level, increase insulin levels and suppress glucagon production.
Figure Glucose-Dependent Effects of GLP-1 on Insulin and Glucagon Levels in Patients With Type 2 Diabetes [262]

In one of the earliest studies with GLP-1, Gutniak et al. showed that a continuous intravenous infusion of GLP-1 resulted in a reduction in the amount of insulin needed to maintain isoglycemia in patients with either type 1 or type 2 diabetes. [263] Few years later, Zander et al., in a non-randomized parallel group study, showed that six weeks of continuous subcutaneous infusion of GLP-1 not only reduced fasting and postprandial plasma glucose concentrations, but also lowered glycosylated hemoglobin (A1C) by 1.3%, and induced up to a 2 kg reduction in body weight. [264]
Juntti-Berggren et al. reported the first randomized trial with the addition of subcutaneous infusion of GLP-1 to regular insulin therapy, and compared it with insulin therapy alone in 12 patients with type 2 diabetes. [265] After initial intensive insulin therapy for 1 week, 8 patients were randomized to receive a subcutaneous infusion of GLP-1 along with injections of regular insulin with meals, and NPH insulin at bedtime, whereas 4 patients were randomized to regular insulin with meals and NPH insulin at bedtime. A significant reduction in postprandial glucose concentration was observed after one week of treatment in patients receiving subcutaneous infusion of GLP-1 added to insulin therapy, compared to insulin therapy alone. Furthermore, an additive lipid-lowering effect was also observed in the GLP-1 infused patients. [266]
In 2001, Larsen et al. reported a randomized trial with continuous intravenous infusion of GLP-1 versus placebo infusion, in 40 hospitalized patients with type 2 diabetes, poorly controlled with sulfonylurea treatment.63 Patients received an infusion of GLP-1 at 4 or 8 ng/kg/min for 16 or 24 hours, versus placebo, for 7 days. Patients infused with GLP-1 showed a significant, dose-dependent, reduction in mean 24-hour plasma glucose concentrations compared with placebo. The fasting and nocturnal plasma glucose concentration was higher in the 16-h GLP-1 infused patients compared to the 24-h GLP-1 infused patients. GLP-1 infusion was also associated with a dose related increase in nausea, headache, and vomiting. [267]
In another randomized study published in 2003 (Meneilly et al.), 16 elderly, insulin-naïve patients with diabetes were divided in two groups of 8 patients each, and given either a continuous subcutaneous infusion of GLP-1 at an initial dose of 100 pmol/kg/h, titrated up to a maximum dose of 120 pmol/kg/h for 12 weeks, compared to controls treated with conventional therapy. [268] Concomitant treatment with glucose lowering agents was discontinued for 1 week prior to study treatment in the group of patients infused with GLP-1, while the control group continued with their usual glucose lowering therapy without any dose changes. GLP-1 infusion was well tolerated, without significant side effects. Hypoglycemia occurred only once in the GLP-1 treatment group, while hypoglycemic events were frequent in the control group (87 events). No significant changes in A1C were observed, despite a discontinuation of oral hypoglycaemic medications in the GLP-1 treated group. There was an enhanced glucose-induced insulin secretion, as well an in insulin-mediated glucose disposal, in the GLP-1 infused group compared to controls. [269]
In 2004, Zander et al. reported a randomized cross-over trial that evaluated the additive effect of continuous infusion of GLP-1 and a TZD, pioglitazone, in patients with type 2 diabetes. [270] Eight patients with type 2 diabetes were given a saline infusion, continuous infusion of GLP-1 (4.8 pmol/kg/min), pioglitazone treatment (30 mg), and a combination treatment with GLP-1 infusion and pioglitazone, in a random order. During the studies with either saline or GLP-1 only infusions, the patients discontinued their normal medications for three weeks, with a 2-day washout period between the saline or GLP-1 infusions. During the studies with pioglitazone with or without GLP-1 infusion, all patients received 30 mg of pioglitazone for 12 weeks and then were randomly assigned to a 48-hour monotherapy period with either pioglitazone or a combination of GLP-1 with pioglitazone. A significant drop in fasting plasma glucose (FPG) concentrations in the GLP-1 only, pioglitazone only, and the combination of pioglitazone with GLP-1 group were observed compared to saline infusion group. FPG was lower in combination therapy compared to monotherapy with either agent. Mean insulin concentrations were significantly higher with GLP-1 compared with pioglitazone. Glucagon concentrations were reduced in both GLP-1 treated arms compared to saline and pioglitazone treatments, and a sensation of appetite reduction was also noted in the GLP-1 treatment arms. [271]
All these studies demonstrated the clinical potential of GLP-1 therapy in patients with type 2 diabetes. Unfortunately, for reasons of practicality, intravenous or subcutaneous continuous infusion of GLP-1 is not practical, as a long-term treatment of diabetes.
Two classes of agents have been developed to take advantage of the unique glucoregulatory potential of GLP-1:
-
The incretin mimetics, such as exenatide (synthetic exendin-4, a peptide resistant to proteolytic cleavage by DPP-IV) or derivatives of GLP-1 (created by chemical modification of the native hormone, to render them resistant to rapid proteolytic cleavage by DPP-IV), targeting the pharmacological effects, and insufficient secretion of GLP-1 seen in type 2 diabetes; and
-
The DPP-IV inhibitors, compounds that increase the concentration of endogenous incretins, including GLP-1, by limiting the proteolytic cleavage by DPP-IV.
Figure Pharmacologic effects of GLP-1

Incretin Mimetics
Exenatide
Exenatide (Byetta) is a synthetic exendin-based GLP-1 analog that 53% homologous to native GLP-1. It is a synthetic version of exendin-4, a peptide originally identified in the saliva of the Gila monster (Heloderma suspectum), and secreted upon ingestion of nutrients. [272][273] It received regulatory approval in 2005. Exenatide is administered via a pre-filled subcutaneous injection device at a dose of 5 or 10 mcg twice daily, within 60 minutes before morning and evening Current approved indications are add on to metformin, sulfonylurea, thiazolidinedione, a combination of metformin and a sulfonylurea, or a combination of metformin and a thiazolidinedione. It is not currently approved as as monotherapy.
Mechanism of Action
While exendin-4 has many of the properties of GLP-1, the two peptides are unique and are transcribed from distinct genes in the Gila monster. In humans and animal studies, exenatide enhances glucose-dependent insulin secretion, suppresses the elevated postprandial glucagon levels seen in type 2 diabetes, and slows the rate of gastric emptying [274][275][276] (which can be paradoxically accelerated in many people with diabetes). [277] In addition, both exenatide and GLP-1 have been reported to promote β-cell proliferation and neogenesis from ductal precursor in animal models. [278][279][280][281][282][283] Data obtained in animal models also indicate that exenatide reduces food intake, promotes weight loss, and partially due to this weight loss has an insulin sensitizing effect. [284][285][286] Moreover, exenatide has been shown to reduce food intake in healthy humans. [287] Exenatide does not appear to be significantly degraded in the circulation, and is primarily cleared by the kidneys. [288] After a subcutaneous injection, exenatide plasma concentrations increase in a dose-dependent manner (tmax of approximately 2 hours) and decay in a linear manner (t1/2 of 3.3 to 4.0 hours). [289][290]
Given the mechanism of action, the expected effect of the medication would be to lower postprandial glucose excursions. As shown in a study comparing the addition of either basal insulin or exenatide, exenatide supresses the postprandial excursion while the basal insulin lowers fasting glucoses without any effect on postprandial levels. This is seen in figure below.
Figure Comparison of exenatide vs basal insulin on 24 hour glucose pattern. [291]

Efficacy
Three large randomized, placebo-controlled clinical trials with subcutaneous administration of exenatide (bid), conducted in subjects with type 2 diabetes who were unable to achieve glycemic control with sulfonylureas and/or metformin, demonstrated that exenatide treatment resulted in mean reductions in A1C from baseline of ~1% accompanied by an average weight loss of 2 to 3 kg in those treated with 10 mcg exenatide BID. [292][293][294]
Though not approved for monotherapy in a 30-week study of exenatide 10 mcg twice daily, used as monotherapy or in combination with one or two oral therapies there was an A1C reduction of 1.5% from baseline. [295]
Side Effects
Mild-to-moderate nausea was the most commonly reported adverse event associated with exenatide, occurring with greatest frequency upon initiation, and generally subsiding with continued exposure to exenatide.[296][297][298]Few new episodes of nausea were reported after 4 weeks of treatment. Furthermore, stepwise dose escalation was found to reduce the incidence of nausea and vomiting. [299] There was no increase in the risk of hypoglycemia when exenatide was administered in combination with metformin, most likely due to the glucose-dependent actions of exenatide. However, the risk of hypoglycemia increased when exenatide was administered with a sulfonylurea, and this risk was greater when A1C was closer to normal, and the dose of sulfonylurea was not concomitantly reduced. The FDA had required addition of two warnings based on post-release reports. In 2008, the product lable was updated to reflect FDA concern over reports of possible association of the drug with pancreatitis [300]In November 2009, based on 78 reports of altered renal function, an alert on possible alteration in function was issued [301].
Approximately 45% of patients in these studies developed anti-exenatide antibodies; however, the presence of antibodies, and/or the magnitude of the antibody titer, were not associated with an individual patient’s magnitude of glycemic improvement, nor was there an association with incidence of adverse events.[302][303][304]
Liraglutide
Mechanism of Action
Mechanism of action is as described above
Efficacy
Liraglutide at daily subcutaneous monotherapy doses of 1.2 and 1.8 mg as monotherapy decreased HgA1c levels from baseline by –0.84% and –1.14%, respectively, over 52 weeks, achieving significantly greater reductions than sulfonylurea therapy (decrease of of –0.51%). [305] In data from four clinical trials of liraglutide in combination with one or two oral therapies there were reductions of of HgA1c levels of 1.0% to 1.5% for liraglutide 1.2 mg (versus placebo), and –1.0% to –1.5% for 1.8 mg (versus placebo). [306] [307][308][309] In these clinical trials of 26 to 52 weeks, liraglutide 1.2 to 1.8 mg/day produced weight reductions of –1.0 to–3.2 kg.
Side Effects
In monotherapy or combination therapy trials, the rate of hypoglycemia ranged from 3% to 12%. There were no episodes requiring assistance from another person. When combinedwith a sulfonylureas the incidence ranged from 5% to 27% with Six liraglutide-treated patients requiring assistance. [310][311][312]
5% to 40% of liraglutide-treated patients complained of nausea but this generally subsided within the first 4 weeks of use. [313][314][315][316]
Antibodies to liraglutide were found in 4% to 13% of subjects and did not appear to have any significant effect on the HgA1c-lowering efficacy of liraglutide.[317][318][319]
Dipeptidyl Peptidase IV (DPP-IV) Inhibition
As described above, DPP-IV inhibitors are compounds that increase the concentration of endogenous incretins, including GLP-1, by limiting the proteolytic cleavage by DPP-IV. As shown in Figure , above, GLP-1 is an insulinotropic hormone secreted by L-cells of the small intestine that stimulates insulin secretion in a glucose-specific manner, inhibits gastric emptying, suppresses glucagon secretion, and has central anorexic activity [320][321]. Although it possesses multiple effective clinical activities, administration of GLP-1 is not an ideal approach since it cannot be administered orally. Furthermore, endogenous (and exogenously administered) GLP-1 has undesirable pharmacokinetics; after it is secreted, it is rapidly cleaved and inactivated [plasma half-life < 1 min; [322]] by the enzyme dipeptidyl peptidase IV (DPP-IV). Thus, inhibition of DPP-IV has been suggested as a feasible alternative to elevate circulating GLP-1 levels, and circumvent the limitations of GLP-1 administration [323][324][325][326][327][328][329][330].
The initial, orally active DPP-IV inhibitor, NVP-DPP728, was identified and characterized in vitro and in vivo [331][332][333][334][335].
Inhibition of DPP-IV by NVP-DPP728 resulted in a significantly amplified early phase of the insulin response to an oral glucose load in obese fa/fa rats, and restoration of glucose excursions to normal [336]. In contrast, DPP-IV inhibition produced only minor effects in lean FA/? rats. Inactivation of GLP-1 (7-36) amide was completely prevented by DPP-IV inhibition suggesting that the effects of this compound on oral glucose tolerance were mediated by increased circulating concentrations of GLP-1 (7-36) amide.
In DPP-IV(+) [but not in DPP-IV(-)] transgenic rats fed either standard chow or a high-fat diet, NVP-DPP728 significantly suppressed glucose excursions after glucose challenge by inhibiting the plasma DPP-IV activity, associated with the stimulation of early insulin secretion [337]. NVP-DPP728 also improved the glucose tolerance after an oral glucose challenge by potentiating the early insulin response by inhibition of plasma DPP-IV activity in aged DPP-IV(+) Wistar and F344 rats [338]. In contrast, NVP-DPP728 did not affect the glucose tolerance after an oral glucose challenge in aged DPP-IV(-)F344 rats ([339]. Taken together, these results indicate that treatment with NVP-DPP728 ameliorates glucose tolerance in vivo by the direct inhibition of plasma DPP-IV activity, and presumably the subsequent increase in endogenous GLP-1 action.
The clinical activity of this compound as a monotherapy was reported in patients at an early stage of type 2 diabetes [340]. Compared with placebo, NVP-DPP728 at 100 mg (tid; n =31) significantly reduced fasting glucose by 18 mg/dl (1.0 mmol/l), prandial glucose excursions by 21.6 mg/dl (1.2 mmol/l), and mean 24-h glucose levels by 18 mg/dl (1.0 mmol/l). Similar reductions were seen in the 150-mg (bid; n = 32) treatment group. Mean 24-h insulin was significantly reduced by 26 pmol/l in both groups. In the combined active treatment groups, HbA1c was significantly reduced from 7.4 ± 0.7% to 6.9 ± 0.7%. Laboratory safety and tolerability were good in all groups. These results provided clinical proof of concept that inhibition of DPP-IV is a feasible approach for the treatment of type 2 diabetes in the early stage of the disease.
Vildagliptin
Sitagliptin
Sitagliptin ( Januvia™), a selective DPP-IV inhibitor, received regulatory approval in the US [341] in 2006.
Figure Structure of Sitagliptin

Mechanism of Action
As described above, DPP-IV inhibitors are compounds that increase the concentration of endogenous incretins, including GLP-1, by limiting the proteolytic cleavage by DPP-IV. The clinical effect is to stimulate insulin secretion in a glucose-specific manner and suppress glucagon secretion.
Efficacy
In sitagliptin monotherapy studies HgA1c was reduced from baseline by .28% to 0.76% at 12 to 24 weeks. [342][343][344][345][346][347][348]. As an add on agent, there were HgA1c reductions of 0.45% to 1.0% at 24 to 30 weeks. [349][350][351][352] [353][354] In the studies discussed above, there were no significant effects on weight reported.
Side Effects
As monotherapy, the incidence of hypoglycemic was reported between 0.5% to 2.2%, with no severe episodes. [355][356][357][358] [359][360][361] When used in combination with a sulfonylurea,hypoglycemia occurred in 12.2% of patients, but no severe events were reported. [362]
Gastrointestinal events rarely occur. Headaches (incidence of 1.8% to 5.7%), nasopharyngitis (2.9% to 9.1%), and upper respiratory tract infection (0% to8.8%) have been reported.
Saxagliptine
Saxagliptin ( Ongyza), a selective DPP-IV inhibitor, received regulatory approval in the US in 2009.
Figure Structure of Saxagliptine

Mechanism of Action
As described above, DPP-IV inhibitors are compounds that increase the concentration of endogenous incretins, including GLP-1, by limiting the proteolytic cleavage by DPP-IV. The clinical effect is to stimulate insulin secretion in a glucose-specific manner and suppress glucagon secretion.
Efficacy
When added to a sulfonylurea, Saxagliptin at doses of 2.5 mg and 5 mg, decreased HgA1c by 0.54% to 0.64%. The same doses decreased HgA1c by 0.66% to 0.94% when added to a thiazolidinedione (0.30% decrease seen with a thiazolidinedione plus placebo).[363][364]
Side Effects
At doses of 2.5 and 5 mg, saxagliptin was associated with a hypoglycmia incidence of 2.7% to 4.1% when combined with a thiazolidinedione and 13.3% to 14.6% when combined with a sulfonylurea.).[365][366]
Bile Acid Sequestrant
Mechanism of Action
Colesevelam hydrochloride (WelCHOL) is a non-absorbed, polymeric, lipid-lowering and glucose-lowering agent intended for oral administration. It is excreted pirmarily in the feces. Colesevelam hydrochloride is a high-capacity bile acid-binding molecule. It is poly(allylamine hydrochloride) cross-linked with epichlorohydrin and alkylated with 1-bromodecane and (6-bromohexyl)-trimethylammonium bromide. The actual glucose lowering mechanism of action remains under investigation. Proposed mechanisms include:
- decreased or slowed absorption of glucose and carbohydrates, reducing postprandial glucose excursions [367][368]
- alteration of nuclear receptors such as the liver X receptor (LXR).[369]
- alteration of GLP-1 levels[370]
Figure Structure of Colesevelam

Efficacy
Prior to FDA approval, three phase 3 clinical trials investigated the glucose-lowering efficacy of colesevelam HCl when added to insulin-, metformin-, or sulfonylurea based therapy, in patients with inadequately controlled type 2 diabetes (initial HgA1C, 7.5% to 9.5%) [371]. Results showed the addition of colesevelam HCl to the existing, antidiabetes therapy resulted in a significant placebo- corrected reduction in A1C (0.50%, 0.54%, and 0.54%, respectively [P<.001 for all) [372][373][374]
Side Effects
As colesevelam is minimaly absorbed from the gastrointestinal tract, few systemic systemic adverse events occur after oral administration.[375] A combination of 4 studies with enrolment of 1129 subjects (567 patients receiving colesevelam; 562 patients receiving placebo) showed 8.6% Colesevelam vs 2.0% placebo subjects complained of constipation. There were no differences in nasopharyngitis, dyspepsia, hypoglycemia, nausea, or hypertension. [376]
Dopamine Agonist
In 2009, bromocriptine mesylate a medication available for many decades, was approved as an adjunct to diet and exercise to improve glycemic control in adults with type-2 diabetes mellitus. This drug specifically approved was a quick-release preparation developed by Vero Science Inc, under the trade name Cycloset. Bromocriptine, is a centrally-acting dopamine D 2 receptor agonist that had been approved for the treatment of hyperprolactinemia-associated dysfunctions, acromegaly and Parkinson disease. The idea of using bromocriptine for the treatment of type-2 diabetes came while studying the metabolism of migrating birds; that they develop seasonal insulin resistance and dopamine plays a role in it.
Mechanism of Action
Based on insulin-glucose clamp studies, the beneficial effect of bromocriptine on glucose homeostasis does not appear to be related to enhanced insulin-mediated glucose disposal or a reduction in basal endogenous glucose production . Potential unexplored mechanisms by which bromocriptine reduces the mean daylong plasma glucose levels include enhanced suppression of endogenous glucose production and/or increased splanchnic glucose uptake after glucose ingestion.[377]
Figure Structure of Bromocriptine

Efficacy
As shown in Figure below, an early short placebo control study demonstrated a modest improvement in fasting glucose and HgA1c levels. In studies filed with the FDA but not yet published, for the specific preparation, Cycloset, demonstrate minimal change in FBS and HgA1c from baseline and modest improvement from placebo. These results are shown in the Table below.
Table Changes in HgA1c and FBS with the Bromocriptine preparation Cycloset[378]
| Change from Baseline | Change from Placebo | |
| Monotherapy | ||
| HgA1c | -0.1 | -0.4 |
| FBS | 0 | -23 |
| Add to Sulphonylurea | ||
| HgA1c | -0.25 | -0.55 |
| FBS | +7 | -19 |
| Add to metformin and sulphonylurea | ||
| HgA1c | -0.5 | -0.5 |
Figure Time course of change from baseline in HbA1c and FPG concentrations
in bromocriptine and placebo-treated subjects [379]

Side Effects
The most common adverse events associated with bromocriptine mesylate are nausea, fatigue, dizziness, vomiting and headache. Clinical trial data reveal that bromocriptine mesylate at doses up to 4.8 mg per day was not associated with a different rate of all-cause adverse events compared with placebo. However, the drug is known to be associated with Nasal Stuffiness, Nausea, headache, constrictive pericarditis, neuroleptic malignant syndrome, and hypotension The incidence of hypoglycemia was 6.9% among bromocriptine mesylate-treated patients compared with 5.3% of patients receiving placebo.
In the pooled CYCLOSET phase 3 clinical trials (CYCLOSET N = 2298; placebo N = 1266), adverse events leading to discontinuation occurred in 539 (24%) CYCLOSET-treated patients and 118 (9%) placebo-treated patients. This between-group difference was driven mostly by gastrointestinal adverse events, particularly nausea. [380]
The drug is contraindicated in patients with known hypersensitivity to bromocriptine or ergot-related drugs. It is also contraindicated in patients with syncopal migraine. Bromocriptine increases the likelihood of a hypotensive episode among patients with syncopal migraine. It is also contraindicated in nursing women as it may inhibit lactation. There are postmarketing reports of stroke in these patients although causality has not been proven.
Pramlintide
The hormone amylin (figure 6) is cosecreted with insulin by the pancreatic beta-cells in response to nutrient stimuli. [381][382]Patients with type 1 diabetes may develop an absolute deficiency of both insulin and amylin, [383] and those with type 2 DM have impaired beta-cell secretion amylin in response to a meal. [384]
Amylin suppresses postprandial arginine-induced glucagon secretion [385]and slowed gastric emptying time. [386] Pramlintide (Figure 6) is a Soluble Analog of Human Amylin allowing clinical application of this hormone.
Figure 6. Structure of Human Amylin and Pramlintide

Mechanism of Action
Pramlintide, an injectable synthetic analog of amylin, slows gastric emptying, attenuates postprandial glucagon secretion, enhances satiety, and reduces food intake. [387][388][389]
Efficacy
When added to preprandial insulin, pramlintide improves post-prandial glucose control and promotes weight loss in patients with both type 1 and type 2 diabetes. [390][391][392][393][394][395][396] As shown in figure 7, postprandial glucose excursions are significantly blunted with the addition of pramlitide. Effects on HgA1c reduction are modest, with 52 week net reduction of .27% at 1 year [397]. Similar reductions in hemoglobin A1c and weight have been reported in insulin treated patients with type 2 diabetes. [398][399]
Figure 7. Effect of Pramlintide on postrandial glucose. [400]

Pramlitide has also been used as a premeal injection without concurrent premeal insulin in Type 2 diabetes. In preliminary studies, when compared to patients receiving preprandial insulin, these patients were able to achieve similar glucose control with less hypoglycemia and without the weight gain seen with preprandial insulin. [401]
Figure 8. Comparison of postprandial insulin and pramlintide on glucoses and weight.[402]
Side Effects
To date, there have not been any significant reports of toxicity to any major organs, significant elevation in laboratory test, alteration in vital signs, electrocardiographic parameters, or physical exams. Overall, nausea, vomiting, and anorexia were the most frequently reported adverse drug events associated with pramlintide therapy. Rates of nausea were generally16.5- 25% (pramlintide) vs 9.5- 16% ( control group). In patients with type 1 DM these symptoms were mild to moderate and transient (within the first 4-8 weeks). The findings were similar in patients with type 1 and those with type 2 DM. [403][404]
Emerging Approaches
The development pipeline for new oral therapeutic agents for type 2 diabetes is encouraging and continues to expand. These intensive research and development efforts are in response to the increasing prevalence of the disease and related co-morbidities, realization by care givers that successful glycemic control will likely require combination therapy, a growing understanding of the pathophysiology of the disease, and the identification and validation of new pharmacological targets. These targets include receptors and enzymes that: enhance glucose-stimulated insulin secretion, suppress hepatic glucose production, increase skeletal muscle glucose transport and utilization, increase insulin sensitivity and intracellular insulin signaling, and reduce circulating and intracellular lipids (109-113). Due to their promise for future clinical success and because they exhibit mechanisms of action distinct from current therapies, two such emerging approaches will be highlighted here.
The appetite-stimulating actitivity of Cannabis sativa has long been known through traditional recreational and medicinal use [405][406]. The active molecule, delta-9-tetrahydrocannabinol (THC), was initially purified in 1964 [407], but the discoveries of cannabinoid receptors and their endogenous ligands did not occur until more recently, within the last 15 years [408]. The endocannabinoid system is composed of two distinct G-protein-coupled cannabinoid receptors (CB1 and CB2), two major endogenous ligands (anandamide and 2-arachidonyl glycerol), and the enzymes responsible for ligand synthesis (N-acylphosphatidylethanolamine-specific phospholipase D and diacylglycerol lipase) and degradation (fatty acid amide hydrolase and monoacylglycerol lipase). CB1 receptors are widely distributed on central and peripheral neurons, and also present in adipose tissue, liver, muscle, pancreas, heart, vasculature, and the gastrointestinal tract [409][410]. The distribution of CB2 receptors is more limited, where they are mainly associated with the immune system and hematopoisesis [411][412]. Ligand stimulation of the receptors results in decreased adenylate cyclase activity and cAMP production, along with a reduction in intracellular calcium.
The endocannabinoid system was identified as playing a significant role in the regulation of food intake and energy metabolism . There is some evidence that the endocannabinoid system is consituitively active in certain regions of the brain that are known to control energy balance, suggesting that tonic activation favors energy intake, storage, and weight gain [413]. In rodents, activation of CB1 (but not CB2) receptors by endogenous ligands or THC stimulates feeding [414][415][416], while CB1-deficient mice are protected against diet-induced obesity [417][418]. In human obesity, it has been reported that fatty acid amide hydrolase, the enzyme that degrades anandamide, is reduced [419], and that a missense mutation is associated with increased body mass index [420]. Taken together, these data have provided the scientific rationale for the idea that pharmacological antagonists of CB1 might offer a promising approach to treat obesity.
Rimonabant is a selective CB1 receptor antagonist for obesity and smoking cessation [421][422][423][424]. Animal studies have convincingly demonstrated that this compound exerts a beneficial effect on reducing hunger, caloric intake, and body weight, and for increasing satiety [425]. In humans, rimonabant was equally effective as judged by initial clinical studies [426][427][428][429][430] , but due to concern over its depressive side effects, the drug was not approved for use in the United States and after initial approval in Europe was removed from the market. Nevertheless, this mechanism of action may be utilized in the future.
Despite the magnitude of the disease, the choice of oral antihyperglycemic drugs for type 2 diabetes was limited to sulfonylureas for over 40 years. The last 11 years have witnessed the introduction of five new classes of oral antihyperglycemic therapies. Each possesses a distinct mechanism of action, which enables their use independently and, in some cases, as combination therapy. This is important since most patients with type 2 diabetes will require combination therapy to reach an acceptable level of glycemic control [431]. However, despite these advances, there is still plenty of room and necessity for improvement.
The successful long-term management (and hopefully prevention) of type 2 diabetes and its related co-morbidities undoubtedly requires an aggressive, comprehensive approach. This includes intervention at the pre-diabetes stage (e.g. obesity, impaired glucose tolerance) including both changes in lifestyle (i.e. dietary modification and exercise), along with pharmacological intervention that might delay or even prevent the development of the disease and / or its complications. However, once the disease is established and beyond the control of lifestyle modifications, treatment must be initiated and carefully monitored using existing drugs that address the current understanding of the pathophysiology: impaired insulin secretion, increased hepatic glucose production, and peripheral tissue insulin resistance. It is anticipated that emerging agents will also have a beneficial impact on these processes, but with greater efficacy and safety due to a higher degree of selectivity for their molecular targets. In addition, new information regarding the biochemistry, cell biology, and pathophysiology of the disease process is rapidly providing additional exciting opportunities for target identification, validation and subsequent drug development.
The biological effects of emerging agents will not be limited to lowering blood glucose. Already, there are some new agents in clinical development that have been designed to afford a combination of benefits, including the reduction of both lipids and glucose. Other new therapies will likely address the emerging belief that there is a significant inflammatory component of the disease. Perhaps, this might be why tight glycemic control alone has experienced limited success at reducing the risk of macrovascular complications of diabetes. Targeting the risk factors for heart disease clearly requires serious attention and concomitant therapy. The complexity of type 2 diabetes and associated co-morbidities will continue to present a formidable challenge for successful pharmacological treatment. However, based on the growing sophistication of 21st Century research approaches [432][433][434][435][436][437][438][439] along with the realization of the consequences of failure [440][441], there is ample support for the optimistic viewpoint that the current selection of orally active treatment options will continue to expand.
Footnotes
- http://apps.nccd.cdc.gov/DDTSTRS/FactSheet.aspx. Accessed 10/2009 ▲
- http://www.eatlas.idf.org/ Accessed 10/2009 ▲
- Reaven GM. Insulin resistance and its consequences: type 2 diabetes mellitus and coronary heart disease. In: LeRoith D, Taylor SI, Olefsky JM, editors. Diabetes Mellitus: A Fundamental and Clinical Text. Philadelphia: Lippincott Williams & Wilkins, 2000: 604-615. ▲
- Reaven GM. Role of insulin resistance in human disease. Diabetes 1988; 37:1595-1607. ▲
- DeFronzo RA. Pathogenesis of type 2 diabetes: metabolic and molecular implications for identifying diabetes genes. Diabet Rev 1997; 5:177-269 ▲
- Hill JO, Wyatt HR, Reed GW, Peters JC. Obesity and the environment: where do we go from here? Science 2003; 299:853-855. ▲
- Turner RC, Cull CA, Frighi V, Holman RR. Glycemic control with diet, sulfonylurea, metformin, or insulin in patients with type 2 diabetes mellitus - Progressive requirement for multiple therapies (UKPDS 49). J Am Med Assoc 1999; 281:2005-2012 ▲
- Lebovitz HE. Insulin Secretogogues. In: LeRoith D, Taylor SI, Olefsky JM, editors. Diabetes Mellitus: A Fundamental and Clinical Text. Philadelphia: Lippincott Williams & Wilkins, 2000: 769-778. ▲
- Groop LC. Drug treatment of non-insulin-dependent diabetes mellitus. In: Pickup JC, Williams G, editors. Textbook of Diabetes. London: Blackwell, 1998: 1-18. ▲
- DeFronzo RA. Pharmacologic therapy for type 2 diabetes mellitus. Ann Intern Med 1999; 131:281-303. ▲
- Mudaliar S, Henry RR. New oral therapies for type 2 diabetes mellitus: The glitazones or insulin sensitizers. Annu Rev Med 2001; 52:239-257. ▲
- Matthaei S, Stumvoll M, Kellerer M, Haring HU. Pathophysiology and pharmacological treatment of insulin resistance. Endocr Rev 2000; 21:585-618. ▲
- Scheen AJ. Clinical efficacy of acarbose in diabetes mellitus: A critical review of controlled trials. Diabetes Metab 1998; 24:311-320. ▲
- Inzucchi SE. Oral antihyperglycemic therapy for type 2 diabetes: scientific review. J Am Med Assoc 2002; 287(3):360-372 ▲
- Krentz AJ, Bailey CJ. Oral antidiabetic agents: current role in type 2 diabetes mellitus. Drugs 2005; 65:385-411. ▲
- Bolen S, Feldman L, Vassy J, Wilson L, Yeh HC, Marinopoulos S, et al. Systematic review: comparative effectiveness and safety of oral medications for type 2 diabetes mellitus. Ann Intern Med. 2007;147:386-99. ▲
- Bloomgarden ZT, Dodis R, Viscoli CM, Holmboe ES, Inzucchi SE. Lower baseline glycemia reduces apparent oral agent glucose-lowering efficacy: a meta-regression analysis. Diabetes Care 2006; 29:2137-2139. ▲
- The Diabetes Control and Complications Trial Research Group. The effect of intensive treatment of diabetes on the development and progression of long-term complications in insulin-dependent diabetes mellitus. N Engl J Med 1993; 329:977-986. ▲
- UK Prospective Diabetes Study Group. Intensive blood-glucose control with sulphonylureas or insulin compared with conventional treatment and risk of complications in patients with type 2 diabetes (UKPDS 33). UK Prospective Diabetes Study (UKPDS) Group. Lancet 1998; 352:837-853. ▲
- Bonora E. Postprandial peaks as a risk factor for cardiovascular disease: epidemiological perspectives. Int J Clin Pract Suppl 2002;(129):5-11. ▲
- UK Prospective Diabetes Study Group. Intensive blood-glucose control with sulphonylureas or insulin compared with conventional treatment and risk of complications in patients with type 2 diabetes (UKPDS 33). UK Prospective Diabetes Study (UKPDS) Group. Lancet 1998; 352:837-853. ▲
- Nathan DM, Buse JB, Davidson MB et al. Management of hyperglycemia in type 2 diabetes: a consensus algorithm for the initiation and adjustment of therapy: a consensus statement from the American Diabetes Association and the European Association for the Study of Diabetes. Diabetes Care 2006; 29(8):1963-1972 ▲
- The American Association of Clinical Endocrinologists. Implementation conference for ACE outpatient diabetes mellitus consensus conference recommendations: position statement. Article Online 2005; http://www.aace.com/pub/pdf/guidelines/OutpatientImplementationPositionStatement.pdf. ▲
- The Action to Control Cardiovascular Risk in Diabetes Study Group. Effects of intensive glucose lowering in type 2 diabetes. N Engl J Med 2008;358:2545-2559. ▲
- The ADVANCE Collaborative Group. Intensive blood glucose control and vascular outcomes in patients with type 2 diabetes. N Engl J Med 2008;358:2560-2572 ▲
- VA intervention trial. Results released, but not published. ▲
- Bloomgarden ZT, Dodis R, Viscoli CM, Holmboe ES, Inzucchi SE. Lower baseline glycemia reduces apparent oral agent glucose-lowering efficacy: a meta-regression analysis. Diabetes Care 2006; 29:2137-2139. ▲
- Lebovitz HE. Insulin Secretogogues. In: LeRoith D, Taylor SI, Olefsky JM, editors. Diabetes Mellitus: A Fundamental and Clinical Text. Philadelphia: Lippincott Williams & Wilkins, 2000: 769-778. ▲
- Guillam MT, Dupraz P, Thorens B. Glucose uptake, utilization, and signaling in GLUT2-null islets. Diabetes 2000; 49:1485-1491 ▲
- Matschinsky FM. Banting Lecture 1995. A lesson in metabolic regulation inspired by the glucokinase glucose sensor paradigm. Diabetes 1996; 45:223-241. ▲
- Meglasson MD, Matschinsky FM. Pancreatic islet glucose metabolism and regulation of insulin secretion. Diabetes Metab Rev 1986; 2:163-214. ▲
- Inagaki N, Gonoi T, Clement JP et al. Reconstitution of IKATP: an inward rectifier subunit plus the sulfonylurea receptor. Science 1995; 270:1166-1170. ▲
- Lebovitz HE. Insulin Secretogogues. In: LeRoith D, Taylor SI, Olefsky JM, editors. Diabetes Mellitus: A Fundamental and Clinical Text. Philadelphia: Lippincott Williams & Wilkins, 2000: 769-778. ▲
- DeFronzo RA. Pharmacologic therapy for type 2 diabetes mellitus. Ann Intern Med 2000; 133:73-74. ▲
- Turner RC, Cull C, Holman R. United Kingdom Prospective Diabetes Study 17: a 9-year update of a randomized, controlled trial on the effect of improved metabolic control on complications in non-insulin-dependent diabetes mellitus. Ann Intern Med 1996; 124:136-145. ▲
- Dunning BE, Foley JE. New therapies to increase insulin secretion. In: LeRoith D, Taylor SI, Olefsky JM, editors. Diabetes Mellitus: A Fundamental and Clinical Text. Philadelphia: Lippincott Williams & Wilkins, 2000: 836-842. ▲
- Pratley RE, Foley JE, Dunning BE. Rapid acting insulinotropic agents: restoration of early insulin secretion as a physiologic approach to improve glucose control. Curr Pharm Des 2001; 7:1375-1397. ▲
- Fuhlendorff J, Rorsman P, Kofod H et al. Stimulation of insulin release by repaglinide and glibenclamide involves both common and distinct processes. Diabetes 1998; 47:345-351. ▲
- Akiyoshi M, Kakei M, Nakazaki M, Tanaka H. A new hypoglycemic agent, A-4166, inhibits ATP-sensitive potassium channels in rat pancreatic b-cells. Am J Physiol 1995; 268:E185-E193 ▲
- Dunning BE, Foley JE. New therapies to increase insulin secretion. In: LeRoith D, Taylor SI, Olefsky JM, editors. Diabetes Mellitus: A Fundamental and Clinical Text. Philadelphia: Lippincott Williams & Wilkins, 2000: 836-842 ▲
- Dunning BE, Foley JE. New therapies to increase insulin secretion. In: LeRoith D, Taylor SI, Olefsky JM, editors. Diabetes Mellitus: A Fundamental and Clinical Text. Philadelphia: Lippincott Williams & Wilkins, 2000: 836-842 ▲
- Weaver ML, Orwig BA, Rodriguez LC et al. Pharmacokinetics and metabolism of nateglinide in humans. Drug Metab Dispos 2001; 29:415-421. ▲
- Hatorp V, Huang WC, Strange P. Pharmacokinetic profiles of repaglinide in elderly subjects with type 2 diabetes. J Clin Endocrinol Metab 1999; 84:1475-1478 ▲
- Culy CR, Jarvis B. Repaglinide: a review of its therapeutic use in type 2 diabetes mellitus. Drugs 2001; 61:1625-1660. ▲
- Goldberg RB, Einhorn D, Lucas CP et al. A randomized placebo-controlled trial of repaglinide in the treatment of type 2 diabetes. Diabetes Care 1998; 21:1897-1903. ▲
- Marbury T, Huang WC, Strange P, Lebovitz HE. Repaglinide versus glyburide: a one-year comparison trial. Diabetes Res Clin Pract 1999; 43:155-166. ▲
- Moses R, Slobodniuk R, Boyages S et al. Effect of repaglinide addition to metformin monotherapy on glycemic control in patients with type 2 diabetes. Diabetes Care 1999; 22:119-124. ▲
- Raskin P, Jovanovic L, Berger S, Schwartz S, Woo V, Ratner R. Repaglinide/troglitazone combination therapy: improved glycemic control in type 2 diabetes. Diabetes Care 2000; 23:979-983 ▲
- Fuchtenbusch M, Standl E, Schatz H. Clinical efficacy of new thiazolidinediones and glinides in the treatment of type 2 diabetes mellitus. Exp Clin Endocrinol Diabetes 2000; 108:151-163. ▲
- Hollander PA, Schwartz SL, Gatlin MR et al. Importance of early insulin secretion: comparison of nateglinide and glyburide in previously diet-treated patients with type 2 diabetes. Diabetes Care 2001; 24:983-988. ▲
- Kahn SE, Montgomery B, Howell W et al. Importance of early phase insulin secretion to intravenous glucose tolerance in subjects with type 2 diabetes mellitus. J Clin Endocrinol Metab 2001; 86:5824-5829. ▲
- Horton ES, Clinkingbeard C, Gatlin M, Foley JE, Mallows S, Shen S. Nateglinide alone and in combination with metformin improves glycemic control by reducing mealtime glucose levels in type 2 diabetes. Diabetes Care 2000; 23:1660-1665 ▲
- Pratley RE, Foley JE, Dunning BE. Rapid acting insulinotropic agents: restoration of early insulin secretion as a physiologic approach to improve glucose control. Curr Pharm Des 2001; 7:1375-1397 ▲
- Fuchtenbusch M, Standl E, Schatz H. Clinical efficacy of new thiazolidinediones and glinides in the treatment of type 2 diabetes mellitus. Exp Clin Endocrinol Diabetes 2000; 108:151-163 ▲
- Rosenstock J, Hassaman DR, Madder RD, Brazinsky SA, Farrell J, Khutoryansky N, Hale P, Repaglinide Versus Nateglinide Comparison Study Group: Repaglinide versus nateglinide monotherapy: a randomized multicenter study. Diabetes Care 27:1265 –1270, 2004 ▲
- Rosenstock J, Hassaman DR, Madder RD, Brazinsky SA, Farrell J, Khutoryansky N, Hale P, Repaglinide Versus Nateglinide Comparison Study Group: Repaglinide versus nateglinide monotherapy: a randomized multicenter study. Diabetes Care 27:1265 –1270, 2004 ▲
- Marbury T, Huang WC, Strange P, Lebovitz HE. Repaglinide versus glyburide: a one-year comparison trial. Diabetes Res Clin Pract 1999; 43:155-166. ▲
- Damsbo P, Clauson P, Marbury TC, Windfeld K. A double-blind randomized comparison of meal-related glycemic control by repaglinide and glyburide in well- controlled type 2 diabetic patients. Diabetes Care 1999; 22:789-794. ▲
- Bailey CJ, Day C. Traditional plant medicine as treatments for diabetes. Diabetes Care 1989; 12:553-564. ▲
- Bailey CJ, Turner RC. Metformin. N Engl J Med 1996; 334:574-579. ▲
- DeFronzo RA. Pharmacologic therapy for type 2 diabetes mellitus. Ann Intern Med 2000; 133:73-74. ▲
- Davidson MB, Peters AL. An overview of metformin in the treatment of type 2 diabetes mellitus. Am J Med 1997; 102:99-110 ▲
- Bolen S, Feldman L, Vassy J, Wilson L, Yeh HC, Marinopoulos S, et al. Systematic review: comparative effectiveness and safety of oral medications for type 2 diabetes mellitus. Ann Intern Med. 2007;147:386-99. ▲
- DeFronzo RA, Ferrannini E, Simonson DC. Fasting hyperglycemia in non-insulin-dependent diabetes mellitus: contributions of excessive hepatic glucose production and impaired tissue glucose uptake. Metabolism 1989; 38:387-395. ▲
- Bailey CJ, Turner RC. Metformin. N Engl J Med 1996; 334:574-579. ▲
- Stumvoll M, Nurjhan N, Perriello G, Dailey G, Gerich JE. Metabolic effects of metformin in non-insulin-dependent diabetes mellitus. New England J Med 1995; 333:550-554. ▲
- Cusi K, DeFronzo RA. Metformin: a review of its metabolic effects. Diabetes Rev 1998; 6:89-131. ▲
- Bailey CJ, Turner RC. Metformin. N Engl J Med 1996; 334:574-579. ▲
- Cusi K, DeFronzo RA. Metformin: a review of its metabolic effects. Diabetes Rev 1998; 6:89-131. ▲
- Zhou G, Myers R, Li Y et al. Role of AMP-activated protein kinase in mechanism of metformin action. J Clin Invest 2001; 108:1167-1174. ▲
- Hardie DG, Carling D, Carlson M. The AMP-activated/SNF1 protein kinase subfamily: metabolic sensors of the eukaryotic cell? Annu Rev Biochem 1998; 67:821-855. ▲
- Zhou G, Myers R, Li Y et al. Role of AMP-activated protein kinase in mechanism of metformin action. J Clin Invest 2001; 108:1167-1174. ▲
- DeFronzo RA. Pharmacologic therapy for type 2 diabetes mellitus. Ann Intern Med 1999; 131:281-303 ▲
- Davidson MB, Peters AL. An overview of metformin in the treatment of type 2 diabetes mellitus. Am J Med 1997; 102:99-110 ▲
- Cusi K, DeFronzo RA. Metformin: a review of its metabolic effects. Diabetes Rev 1998; 6:89-131. ▲
- Cusi K, DeFronzo RA. Metformin: a review of its metabolic effects. Diabetes Rev 1998; 6:89-131. ▲
- Turner RC, Holman RR, Stratton IM et al. Effect of intensive blood-glucose control with metformin on complications in overweight patients with type 2 diabetes (UKPDS 34). UK Prospective Diabetes Study (UKPDS) Group. Lancet 1998; 352:854-865. ▲
- Cusi K, DeFronzo RA. Metformin: a review of its metabolic effects. Diabetes Rev 1998; 6:89-131. ▲
- DeFronzo RA, Goodman AM. Efficacy of metformin in patients with non-insulin-dependent diabetes mellitus. The Multicenter Metformin Study Group. N Engl J Med 1995; 333:541-549 ▲
- DeFronzo RA, Goodman AM. Efficacy of metformin in patients with non-insulin-dependent diabetes mellitus. The Multicenter Metformin Study Group. N Engl J Med 1995; 333:541-549 ▲
- Gosmanova EO, Canada RB, Mangold TA, Rawls WN, Wall BM: Effect of metformin-containing antidiabetic regimens on all-cause mortality in veterans with type 2 diabetes mellitus. Am J Med Sci 2008; 336: 241-247 ▲
- Holman RR, Paul SK, Bethel MA, Matthews DR, Neil HA. 10-year follow-up of intensive glucose control in type 2 diabetes. N Engl J Med. 2008;359(15):1577-1589 ▲
- Pan A, Lucas M, Sun Q, et al: Bidirectional Association Between Depression and Type 2 Diabetes Mellitus in Women Arch Intern Med. 2010;170(21):1884-1891 ▲
- Emslie-Smith AM, Boyle DI, Evans JM, Sullivan F, Morris AD; DARTS/MEMO Collaboration Contraindications to metformin therapy in patients with Type 2 diabetes--a population-based study of adherence to prescribing guidelines.Diabet Med. 2001 Jun;18(6):483-8. ▲
- Warren RE, Strachan MW, Wild S, McKnight JA. Introducing estimated glomerular filtration rate (eGFR) into clinical practice in the UK: implications for the use of metformin. Diabet Med. 2007 May;24(5):494-7 ▲
- Warren RE, Strachan MW, Wild S, McKnight JA. Introducing estimated glomerular filtration rate (eGFR) into clinical practice in the UK: implications for the use of metformin. Diabet Med. 2007 May;24(5):494-7 ▲
- Frid A, Sterner GN, Löndahl M, Wiklander C, Cato A, Vinge E, Andersson A.Novel assay of metformin levels in patients with type 2 diabetes mellitus and varying levels of renal function - clinical recommendations.Diabetes Care June 2010 vol. 33 no. 6 1291-1293 ▲
- Wulffele MG, Kooy A, Lehert D, et al. Effects of short-term treatment with metformin on serum concentrations of homocysteine, folate and vitamin B12 in type 2 diabetes mellitus: a randomized, placebo-controlled trial. Journal of Internal Medicine 2003; 254: 455–463 ▲
- DeFronzo RA, Goodman AM. Efficacy of metformin in patients with non-insulin-dependent diabetes mellitus. The Multicenter Metformin Study Group. N Engl J Med 1995; 333: 541–9. ▲
- Tomkin G, Hadden D, Weaver J, Montgomery D. Vitamin-B12 status of patients on long-term metformin therapy. BMJ 1971; 2: 685–786 ▲
- Callaghan T, Hadden D, Tomkin G. Megaloblastic anaemia due to vitamin B 12 malabsorption associated with long-term metformin treatment. BMJ 1980; 280: 1214–15 ▲
- Wile DJ and Toth C. Association of metformin, elevated homocysteine, and methylmalonic acid levels and clinically worsened diabetic peripheral neuropathy. Diabetes Care 2010 Jan; 33:156 ▲
- de Jager J, Kooy A, Lehert P, Wulffelé MG, van der Kolk J, Bets D, Verburg J, Donker AJ, Stehouwer CD.Long term treatment with metformin in patients with type 2 diabetes and risk of vitamin B-12 deficiency: randomised placebo controlled trial.BMJ. 2010 May 20;340:c2181. doi: 10.1136/bmj.c2181. ▲
- Caspary W, Zavada I, Reimold W, Deuticke U, Emrich D, Willms B. Alteration of bile acid metabolism and vitamin-B12-absorption in diabetics on biguanides. Diabetologia 1977;13: 187–93. ▲
- Adams J, Clarke J, Ireland J, Kesson C, Watson W. Malabsorption of vitamin B12 and intrinsic factor secretion during biguanide therapy. Diabetologia 1983; 24: 16–8. ▲
- Bauman WA, Shaw S, Jayatilleke E, Spungen AM, Herbert V. Increased intake of calcium reverses vitamin B12 malabsorption induced by metformin. Diabetes Care 2000; 23:1227–31. ▲
- Bell DS. Metformin-Induced Vitamin B12 Deficiency Presenting as a Peripheral Neuropathy. South Med J. 2010 Feb 3. [Epub ahead of print] ▲
- Sohda T, Mizuno K, Imamiya E, Sugiyama Y, Fujita T, Kawamatsu Y. Studies on antidiabetic agents. II. Synthesis of 5-[4-(1- methylcyclohexylmethoxy)-benzyl]thiazolidine-2,4-dione (ADD-3878) and its derivatives. Chem Pharm Bull 1982; 30:3580-3600. ▲
- Sohda T, Ikeda H, Meguro K. Studies on antidiabetic agents .12. Synthesis and activity of the metabolites of (+/-)-5-[p-[2-(5-ethyl-2-pyridyl)ethoxy]benzyl]- 2,4-thiazolidinedione (pioglitazone). Chem Pharm Bull 1995; 43:2168-2172 ▲
- Mudaliar S, Henry RR. New oral therapies for type 2 diabetes mellitus: The glitazones or insulin sensitizers. Annu Rev Med 2001; 52:239-257. ▲
- Greene DA. Rosiglitazone: a new therapy for type 2 diabetes. Expert Opin Investig Drugs 1999; 8:1709-1719. ▲
- Foyt HL, Ghazzi MN, Hanley RM, Saltiel AR, Whitcomb RW. Thiazolidinediones. In: LeRoith D, Taylor SI, Olefsky JM, editors. Diabetes Mellitus: A Fundamental and Clinical Text. Philadelphia: Lippincott Williams & Wilkins, 2000: 788-797. ▲
- Mudaliar S, Henry RR. New oral therapies for type 2 diabetes mellitus: The glitazones or insulin sensitizers. Annu Rev Med 2001; 52:239-257. ▲
- Boelsterli UA, Bedoucha M. Toxicological consequences of altered peroxisome proliferator-activated receptor gamma (PPARgamma) expression in the liver: insights from models of obesity and type 2 diabetes. Biochem Pharmacol 2002; 63:1-10 ▲
- Greene DA. Rosiglitazone: a new therapy for type 2 diabetes. Expert Opin Investig Drugs 1999; 8:1709-1719 ▲
- Lebovitz HE, Kreider M, Freed MI. Evaluation of liver function in type 2 diabetic patients during clinical trials: evidence that rosiglitazone does not cause hepatic dysfunction. Diabetes Care 2002; 25:815-821. ▲
- Chilcott J, Tappenden P, Jones ML, Wight JP. A systematic review of the clinical effectiveness of pioglitazone in the treatment of type 2 diabetes mellitus. Clin Ther 2001; 23:1792-1823. ▲
- Scheen AJ. Thiazolidinediones and liver toxicity. Diabetes Metab 2001; 27:305-313 ▲
- Woodcock K, Sharfstein JM, Hamburg. Regulatory Action on Rosiglitazone by the U.S. Food and Drug Administration NEJM | September 23, 2010 ▲
- Mudaliar S, Henry RR. New oral therapies for type 2 diabetes mellitus: The glitazones or insulin sensitizers. Annu Rev Med 2001; 52:239-257. ▲
- Goldstein BJ. Current views on the mechanism of action of thiazolidinedione insulin sensitizers. Diabetes Technol Ther 1999; 1:267-275 ▲
- Miyazaki Y, Glass L, Triplitt C et al. Effect of rosiglitazone on glucose and non-esterified fatty acid metabolism in type II diabetic patients. Diabetologia 2001; 44:2210-2219 ▲
- Miyazaki Y, Matsuda M, DeFronzo RA. Dose-response effect of pioglitazone on insulin sensitivity and insulin secretion in type 2 diabetes. Diabetes Care 2002; 25:517-523 ▲
- Kawamori R, Matsuhisa M, Kinoshita J et al. Pioglitazone enhances splanchnic glucose uptake as well as peripheral glucose uptake in non-insulin-dependent diabetes mellitus. AD-4833 Clamp-OGL Study Group. Diabetes Res Clin Pract 1998; 41:35-43. ▲
- Goldstein BJ. Current views on the mechanism of action of thiazolidinedione insulin sensitizers. Diabetes Technol Ther 1999; 1:267-275. ▲
- Saltiel AR, Olefsky JM. Thiazolidinediones in the treatment of insulin resistance and type II diabetes. Diabetes 1996; 45:1661-1669. ▲
- Spiegelman BM. PPAR-gamma: Adipogenic regulator and thiazolidinedione receptor. Diabetes 1998; 47:507-514. ▲
- Lehmann JM, Moore LB, Smitholiver TA, Wilkison WO, Willson TM, Kliewer SA. An antidiabetic thiazolidinedione is a high affinity ligand for peroxisome proliferator-activated receptor gamma(PPAR-gamma). J Biol Chem 1995; 270:12953-12956 ▲
- Kliewer SA, Lehmann JM, Milburn MV, Willson TM. The PPARs and PXRs: nuclear xenobiotic receptors that define novel hormone signaling pathways. Recent Prog Horm Res 1999; 54:345-367. ▲
- Kliewer SA, Lehmann JM, Milburn MV, Willson TM. The PPARs and PXRs: nuclear xenobiotic receptors that define novel hormone signaling pathways. Recent Prog Horm Res 1999; 54:345-367. ▲
- Leibowitz MD, Fievet C, Hennuyer N et al. Activation of PPARdelta alters lipid metabolism in db/db mice. FEBS Lett 2000; 473:333-336 ▲
- Kliewer SA, Lehmann JM, Milburn MV, Willson TM. The PPARs and PXRs: nuclear xenobiotic receptors that define novel hormone signaling pathways. Recent Prog Horm Res 1999; 54:345-367 ▲
- Olefsky JM, Saltiel AR. PPAR gamma and the treatment of insulin resistance. Trends Endocrinol Metab 2000; 11:362-368. ▲
- Picard F, Auwerx J. PPARg and glucose homeostasis. Annu Rev Nutr 2002; 22:167-197. ▲
- Berger J, Moller DE. The mechanisms of action of PPARs. Annu Rev Med 2002; 53:409-435. ▲
- Rosen ED, Walkey CJ, Puigserver P, Spiegelman BM. Transcriptional regulation of adipogenesis. Genes Dev 2000; 14:1293-1307. ▲
- Fajas L, Auboeuf D, Raspe E et al. The organization, promoter analysis, and expression of the human PPAR gamma gene. J Biol Chem 1997; 272:18779-18789 ▲
- Auboeuf D, Rieusset J, Fajas L et al. Tissue distribution and quantification of the expression of mRNAs of peroxisome proliferator-activated receptors and liver X receptor-alpha in humans: no alteration in adipose tissue of obese and NIDDM patients. Diabetes 1997; 48:1319-1327 ▲
- Combs TP, Wagner JA, Berger J et al. Induction of adipocyte complement-related protein of 30 kilodaltons by PPARgamma agonists: a potential mechanism of insulin sensitization. Endocrinology 2002; 143:998-1007 ▲
- Goldstein BJ. Current views on the mechanism of action of thiazolidinedione insulin sensitizers. Diabetes Technol Ther 1999; 1:267-275 ▲
- Miyazaki Y, Glass L, Triplitt C et al. Effect of rosiglitazone on glucose and non-esterified fatty acid metabolism in type II diabetic patients. Diabetologia 2001; 44:2210-2219. ▲
- de Souza CJ, Eckhardt M, Gagen K et al. Effects of pioglitazone on adipose tissue remodeling within the setting of obesity and insulin resistance. Diabetes 2001; 50:1863-1871 ▲
- McGarry JD. Banting lecture 2001: dysregulation of fatty acid metabolism in the etiology of type 2 diabetes. Diabetes 2002; 51:7-18. ▲
- Berg AH, Combs TP, Du X, Brownlee M, Scherer PE. The adipocyte-secreted protein Acrp30 enhances hepatic insulin action. Nat Med 2001; 7:947-953. ▲
- Yamauchi T, Kamon J, Waki H et al. The fat-derived hormone adiponectin reverses insulin resistance associated with both lipoatrophy and obesity. Nat Med 2001; 7:941-946 ▲
- Combs TP, Wagner JA, Berger J et al. Induction of adipocyte complement-related protein of 30 kilodaltons by PPARgamma agonists: a potential mechanism of insulin sensitization. Endocrinology 2002; 143:998-1007 ▲
- Yang WS, Jeng CY, Wu TJ et al. Synthetic peroxisome proliferator-activated receptor-gamma agonist, rosiglitazone, increases plasma levels of adiponectin in type 2 diabetic patients. Diabetes Care 2002; 25:376-380 ▲
- Havel PJ. Control of energy homeostasis and insulin action by adipocyte hormones: leptin, acylation stimulating protein, and adiponectin. Curr Opin Lipidol 2002; 13:51-59. ▲
- Steppan CM, Lazar MA. Resistin and obesity-associated insulin resistance. Trends Endocrinol Metab 2002; 13:18-23. ▲
- Mudaliar S, Henry RR. New oral therapies for type 2 diabetes mellitus: The glitazones or insulin sensitizers. Annu Rev Med 2001; 52:239-257. ▲
- Greene DA. Rosiglitazone: a new therapy for type 2 diabetes. Expert Opin Investig Drugs 1999; 8:1709-1719. ▲
- Chilcott J, Tappenden P, Jones ML, Wight JP. A systematic review of the clinical effectiveness of pioglitazone in the treatment of type 2 diabetes mellitus. Clin Ther 2001; 23:1792-1823 ▲
- Sood V, Colleran K, Burge MR. Thiazolidinediones: a comparative review of approved uses. Diabetes Technol Ther 2000; 2:429-440. ▲
- Goldstein BJ. Differentiating members of the thiazolidinedione class: a focus on efficacy. Diabetes Metab Res Rev 2002; 18 (Suppl 2):S16-S22. ▲
- Boyle PJ, King AB, Olansky L et al. Effects of pioglitazone and rosiglitazone on blood lipid levels and glycemic control in patients with type 2 diabetes mellitus: a retrospective review of randomly selected medical records. Clin Ther 2002; 24:378-396. ▲
- Werner AL, Travaglini MT. A review of rosiglitazone in type 2 diabetes mellitus. Pharmacotherapy 2001; 21:1082-1099 ▲
- Gillies PS, Dunn CJ. Pioglitazone. Drugs 2000; 60:333-343. ▲
- Lebovitz HE, Dole JF, Patwardhan R, Rappaport EB, Freed MI. Rosiglitazone monotherapy is effective in patients with type 2 diabetes. J Clin Endocrinol Metab 2001; 86:280-288. ▲
- Phillips LS, Grunberger G, Miller E, Patwardhan R, Rappaport EB, Salzman A. Once- and twice-daily dosing with rosiglitazone improves glycemic control in patients with type 2 diabetes. Diabetes Care 2001; 24:308-315. ▲
- Sood V, Colleran K, Burge MR. Thiazolidinediones: a comparative review of approved uses. Diabetes Technol Ther 2000; 2:429-440. ▲
- Chilcott J, Tappenden P, Jones ML, Wight JP. A systematic review of the clinical effectiveness of pioglitazone in the treatment of type 2 diabetes mellitus. Clin Ther 2001; 23:1792-1823. ▲
- Goldstein BJ. Differentiating members of the thiazolidinedione class: a focus on efficacy. Diabetes Metab Res Rev 2002; 18 (Suppl 2):S16-S22 ▲
- Gillies PS, Dunn CJ. Pioglitazone. Drugs 2000; 60:333-343 ▲
- Aronoff S, Rosenblatt S, Braithwaite S, Egan JW, Mathisen AL, Schneider RL. Pioglitazone hydrochloride monotherapy improves glycemic control in the treatment of patients with type 2 diabetes: a 6-month randomized placebo-controlled dose-response study. The Pioglitazone 001 Study Group. Diabetes Care 2000; 23:1605-1611. ▲
- Einhorn D, Rendell M, Rosenzweig J, Egan JW, Mathisen AL, Schneider RL. Pioglitazone hydrochloride in combination with metformin in the treatment of type 2 diabetes mellitus: a randomized, placebo-controlled study. The Pioglitazone 027 Study Group. Clin Ther 2000; 22:1395-1409. ▲
- Kipnes MS, Krosnick A, Rendell MS, Egan JW, Mathisen AL, Schneider RL. Pioglitazone hydrochloride in combination with sulfonylurea therapy improves glycemic control in patients with type 2 diabetes mellitus: a randomized, placebo-controlled study. Am J Med 2001; 111:10-17. ▲
- Miyazaki Y, Matsuda M, DeFronzo RA. Dose-response effect of pioglitazone on insulin sensitivity and insulin secretion in type 2 diabetes. Diabetes Care 2002; 25:517-523. ▲
- Miyazaki Y, Mahankali A, Matsuda M et al. Improved glycemic control and enhanced insulin sensitivity in type 2 diabetic subjects treated with pioglitazone. Diabetes Care 2001; 24:710-719 ▲
- Kawamori R, Matsuhisa M, Kinoshita J et al. Pioglitazone enhances splanchnic glucose uptake as well as peripheral glucose uptake in non-insulin-dependent diabetes mellitus. AD-4833 Clamp-OGL Study Group. Diabetes Res Clin Pract 1998; 41:35-43. ▲
- Miyazaki Y, Mahankali A, Matsuda M et al. Improved glycemic control and enhanced insulin sensitivity in type 2 diabetic subjects treated with pioglitazone. Diabetes Care 2001; 24:710-719 ▲
- Miyazaki Y, Matsuda M, DeFronzo RA. Dose-response effect of pioglitazone on insulin sensitivity and insulin secretion in type 2 diabetes. Diabetes Care 2002; 25:517-523 ▲
- Karalliedde J, Buckingham R, Starkie M, Lorand D, Stewart M, Viberti G; Rosiglitazone Fluid Retention Study Group. Effect of various diuretic treatments on rosiglitazone-induced fluid retention J Am Soc Nephrol. 2006;17:3482-90. ▲
- Gorson DM. Significant weight gain with rezulin therapy. Arch Intern Med 1998; 159:99. ▲
- Mudaliar S, Henry RR. New oral therapies for type 2 diabetes mellitus: The glitazones or insulin sensitizers. Annu Rev Med 2001; 52:239-257. ▲
- Anonymous. Physicians' Desk Reference: PDR. Montvale, NJ: Medical Economics Press, 2008 ▲
- Nissen SE, Wolski K. Effects of rosiglitazone on the risk of myocardial infarction and death from cardiovascular causes. N Engl J Med. 2007;356(24):2457-2471. ▲
- Diamond GA, Bax L, Kaul S. Uncertain effects of rosiglitazone on the risk for myocardial infarction and cardiovascular death. Ann Intern Med. 2007 Oct 16;147(8):578-81 ▲
- Lincoff AM, Wolski K, Nicholls SJ, et al. Pioglitazone and risk of cardiovascular events in patients with type 2 diabetes mellitus. JAMA. 2007;298(10):1180-1188. ▲
- Dormandy JA, Charbonnel B, Eckland DJA, et al. Secondary prevention of macrovascular events in patients with type 2 diabetes in the PROactive study (Prospective Pioglitazone Clinical Trial in Macrovascular Events): a randomized controlled trial. Lancet. 2005;366(9493):1279-1289. ▲
- Home PD, Pocock SJ, Beck-Nielsen H, Curtis PS, Gomis R, Hanefeld M, Jones NP, Komajda M, McMurray JJ; RECORD Study Team. Rosiglitazone evaluated for cardiovascular outcomes in oral agent combination therapy for type 2 diabetes (RECORD): a multicentre, randomised, open-label trial. Lancet. 2009 Jun 20;373(9681):2125-35) ▲
- Kahn SE, Haffner SM, Heise MA, Herman WH, Holman RR, Jones NP, Kravitz BG, Lachin JM, O'Neill MC, Zinman B, Viberti G; ADOPT Study Group. Glycemic durability of rosiglitazone, metformin, or glyburide monotherapy. N Engl J Med. 2006 7;355:2427-43 ▲
- Loke YK, Singh S, Furberg CD Long-term use of thiazolidinediones and fractures in type 2 diabetes: a meta-analysis. CMAJ. 2009 6;180:32-9 ▲
- Grey A, Bolland M, Gamble G, Wattie D, Horne A, Davidson J, Reid IR. The peroxisome proliferator-activated receptor-gamma agonist rosiglitazone decreases bone formation and bone mineral density in healthy postmenopausal women: a randomized, controlled trial. J Clin Endocrinol Metab. 2007 ;92:1305-10 ▲
- Glintborg D, Andersen M, Hagen C, Heickendorff L, Hermann AP. Association of pioglitazone treatment with decreased bone mineral density in obese premenopausal patients with polycystic ovary syndrome: a randomized, placebo-controlled trial. J Clin Endocrinol Metab. 2008 ;93:1696-701. ▲
- Lebovitz HE. a-Glucosidase inhibitors as agents in the treatment of diabetes. Diabet Rev 1998; 6:132-145. ▲
- Magner J, Amatruda JM. a-glucosidase inhibitors in the treatment of diabetes. In: LeRoith D, Taylor SI, Olefsky JM, editors. Diabetes Mellitus: A Fundamental and Clinical Text. Philadelphia: Lippincott Williams & Wilkins, 2000 ▲
- DeFronzo RA. Pharmacologic therapy for type 2 diabetes mellitus. Ann Intern Med 1999; 131:281-303. ▲
- Lebovitz HE. a-Glucosidase inhibitors as agents in the treatment of diabetes. Diabet Rev 1998; 6:132-145. ▲
- Magner J, Amatruda JM. a-glucosidase inhibitors in the treatment of diabetes. In: LeRoith D, Taylor SI, Olefsky JM, editors. Diabetes Mellitus: A Fundamental and Clinical Text. Philadelphia: Lippincott Williams & Wilkins, 2000 ▲
- Lebovitz HE. a-Glucosidase inhibitors as agents in the treatment of diabetes. Diabet Rev 1998; 6:132-145. ▲
- Puls W. Pharmacology of glucosidase inhibitors. In: Kuhlmann J, Puls W, editors. Handbook of Experimental Pharmacology: Oral Antidiabetics. Berlin: Springer, 1996: 497-525. ▲
- Lebovitz HE. a-Glucosidase inhibitors as agents in the treatment of diabetes. Diabet Rev 1998; 6:132-145. ▲
- Lebovitz HE. a-Glucosidase inhibitors as agents in the treatment of diabetes. Diabet Rev 1998; 6:132-145. ▲
- DeFronzo RA. Pharmacologic therapy for type 2 diabetes mellitus. Ann Intern Med 1999; 131:281-303 ▲
- Scheen AJ. Clinical efficacy of acarbose in diabetes mellitus: A critical review of controlled trials. Diabetes Metab 1998; 24:311-320. ▲
- Lebovitz HE. a-Glucosidase inhibitors as agents in the treatment of diabetes. Diabet Rev 1998; 6:132-145 ▲
- Magner J, Amatruda JM. a-glucosidase inhibitors in the treatment of diabetes. In: LeRoith D, Taylor SI, Olefsky JM, editors. Diabetes Mellitus: A Fundamental and Clinical Text. Philadelphia: Lippincott Williams & Wilkins, 2000. ▲
- Martin AE, Montgomery PA. Acarbose: An alpha-glucosidase inhibitor. Amer J Health-Syst Pharm 1996; 53:2277-2290 ▲
- Coniff R, Krol A. Acarbose: a review of US clinical experience. Clin Ther 1997; 19:16-26. ▲
- Chiasson JL, Josse RG, Leiter LA et al. The effect of acarbose on insulin sensitivity in subjects with impaired glucose tolerance. Diabetes Care 1996; 19:1190-1193. ▲
- Shinozaki K, Suzuki M, Ikebuchi M, Hirose J, Hara Y, Harano Y. Improvement of insulin sensitivity and dyslipidemia with a new a-glucosidase inhibitor, voglibose, in nondiabetic hyperinsulinemic subjects. Metabolism 1996; 45:731-737. ▲
- Lebovitz HE. a-Glucosidase inhibitors as agents in the treatment of diabetes. Diabet Rev 1998; 6:132-145 ▲
- Lebovitz HE. a-Glucosidase inhibitors as agents in the treatment of diabetes. Diabet Rev 1998; 6:132-145 ▲
- Perley MJ, Kipnis DM: Plasma insulin responses to oral and intravenous glucose: studies in normal and diabetic subjects. J Clin Invest 1967;46:1954 1962 ▲
- Perley MJ, Kipnis DM: Plasma insulin responses to oral and intravenous glucose: studies in normal and diabetic subjects. J Clin Invest 1967;46:1954 1962 ▲
- Lewis JT, Dayanandan B, Habener JF, Kieffer TJ: Glucose dependent insulinotropic polypeptide confers early phase insulin release to oral glucose in rats: demonstration by a receptor antagonist. Endocrinology 2000;141:3710 3716. ▲
- Tseng CC, Kieffer TJ, Jarboe LA, Usdin TB, Wolfe MM: Postprandial stimulation of insulin release by glucose-dependent insulinotropic polypeptide (GIP): effect of a specific glucose-dependent insulinotropic polypeptide receptor antagonist in the rat. J Clin Invest. 1996;98:2440-2445. ▲
- Kolligs F, Fehmann HC, Goke R, Goke B: Reduction of the incretin effect in rats by the glucagon-like peptide 1 receptor antagonist exendin (9-39) amide. Diabetes 1995;44:16-19. ▲
- Edwards CM, Todd JF, Mahmoudi M, Wang Z, Wang RM, Ghatei MA, Bloom SR: Glucagon-like peptide 1 has a physiological role in the control of postprandial glucose in humans: studies with the antagonist exendin 9-39. Diabetes 1999;48:86-93. ▲
- Miyawaki K, Yamada Y, Yano H, Niwa H, Ban N, Ihara Y, Kubota A, Fujimoto S, Kajikawa M, Kuroe A, Tsuda K, Hashimoto H, Yamashita T, Jomori T, Tashiro F, Miyazaki J, Yutaka, S: Glucose intolerance caused by a defect in the entero insular axis: a study in gastric inhibitory polypeptide receptor knockout mice. Proc Natl Acad Sci 1999;96:14843-14847. ▲
- Scrocchi LA, Brown TJ, MaClusky N, Brubaker PL, Auerbach AB, Joyner AL,Drucker DJ: Glucose intolerance but normal satiety in mice with a null mutation in the glucagon-like peptide 1 receptor gene. Nat Med.1996;2:1254-1258. ▲
- Persson K, Gingerich RL, Nayak S, Wada K, Wada E, Ahren B: Reduced GLP-1 and insulin responses and glucose intolerance after gastric glucose in GRP receptor-deleted mice. Am J Physiol Endocrinol Metab.2000;279:E956-E962. ▲
- Toft-Nielsen MB, Damholt MB, Madsbad S, Hilsted LM, Hughes TE, Michelsen BK,Holst JJ: Determinants of the impaired secretion of glucagon-like peptide-1 in type 2diabetic patients. J Clin Endocrinol Metab.2001;86:3717-3723 ▲
- Holst JJ, Gromada J: Role of incretin hormones in the regulation of insulin secretion in diabetic and nondiabetic humans. Amer J Physiol Endocrinol Metab.2004;287:E199 E206. ▲
- Brown JC, Pederson RA: A multiparameter study on the action of preparations containing cholecystokinin-pancreozymin.Scand J Gastroenterol.1970;5:537-541. ▲
- Brown JC: A gastric inhibitory polypeptide-1: The amino acid composition and the tryptic peptides. Can J Biochem.1971;49:255-261. ▲
- Dupre J, Ross SA, Watson D, Brown JC: Stimulation of insulin secretion by gastric inhibitory polypeptide in man. J Clin Endocrinol Metab. 1973;37:826-828. ▲
- Mortensen K, Petersen LL, Orskov C: Colocalization of GLP 1 and GIP in human and porcine intestine. Ann NY Acad Sci 2000;921:469 472. ▲
- Buffa R, Polak JM, Pearse AGE, Solcia E, Grimelius L, Capella C: Identification of the intestinal cell storing gastric inhibitory peptide. Histochemistry 1975;43:249 255. ▲
- Vilsbøll T, Holst JJ: Incretins, insulin secretion and type 2 diabetes mellitus. Diabetologia 2004;47:357 366. ▲
- Lewis JT, Dayanandan B, Habener JF, Kieffer TJ: Glucose dependent insulinotropic polypeptide confers early phase insulin release to oral glucose in rats: demonstration by a receptor antagonist. Endocrinology 2000;141:3710 3716. ▲
- Miyawaki K, Yamada Y, Yano H, Niwa H, Ban N, Ihara Y, Kubota A, Fujimoto S, Kajikawa M, Kuroe A, Tsuda K, Hashimoto H, Yamashita T, Jomori T, Tashiro F, Miyazaki J, Yutaka, S: Glucose intolerance caused by a defect in the entero insular axis: a study in gastric inhibitory polypeptide receptor knockout mice. Proc Natl Acad Sci 1999;96:14843-14847. ▲
- .Vilsbøll T, Krarup T, Madsbad S, Holst JJ: Defective amplification of the late phase insulin response to glucose by GIP in obese Type II diabetic patients. Diabetologia 2002;45:1111 1119. ▲
- .Vilsbøll T, Krarup T, Madsbad S, Holst JJ: Defective amplification of the late phase insulin response to glucose by GIP in obese Type II diabetic patients. Diabetologia 2002;45:1111 1119. ▲
- Meier JJ, Gallwitz B, Siepmann N, Holst JJ, Deacon CF, Schmidt WE, Nauck MA: Gastric inhibitory polypeptide (GIP) dose-dependently stimulates glucagon secretion in healthy human subjects at euglycaemia.Diabetologia 2003;46:798-801 ▲
- Meier JJ, Goetze O, Anstipp J, Hagemann D, Holst JJ, Schmidt WE, Gallwitz B,Nauck MA: Gastric inhibitory polypeptide does not inhibit gastric emptying in humans.Am J Physiol Endocrinol Metab.2004;286:E621-E625. ▲
- Holst JJ, Gromada J: Role of incretin hormones in the regulation of insulin secretion in diabetic and nondiabetic humans. Amer J Physiol Endocrinol Metab.2004;287:E199 E206. ▲
- Vilsbøll T, Krarup T, Madsbad S, Holst JJ: Defective amplification of the late phase insulin response to glucose by GIP in obese Type II diabetic patients. Diabetologia 2002;45:1111 1119 ▲
- .Vilsbøll T, Krarup T, Madsbad S, Holst JJ: Defective amplification of the late phase insulin response to glucose by GIP in obese Type II diabetic patients. Diabetologia 2002;45:1111 1119. ▲
- Holst JJ, Gromada J: Role of incretin hormones in the regulation of insulin secretion in diabetic and nondiabetic humans. Amer J Physiol Endocrinol Metab.2004;287:E199 E206. ▲
- Rothenberg ME, Eilertson CD, Klein K, Zhou Y, Lindberg I, McDonald JK,Mackin RB, Noe BD: Processing of mouse proglucagon by recombinant prohormone convertase 1 and immunopurified prohormone convertase 2 in vitro. J Biol Chem.1995;270:10136-10146 ▲
- Rouille Y, Kantengwa S, Irminger JC, Halban PA: Role of the prohormone convertase PC3 in the processing of proglucagon to glucagon-like peptide 1. J Biol Chem.1997;272:32810-32816. ▲
- Ugleholdt R, Zhu X, Deacon CF, Orskov C, Steiner DF, Holst JJ: Impaired intestinal proglucagon processing in mice lacking prohormone convertase 1.Endocrinology.2004;145:1349-1355. ▲
- Orskov C, Wettergren A, Holst JJ: Biological effects and metabolic rates of glucagonlike peptide-1 7-36 amide and glucagonlike peptide-1 7-37 in healthy subjects are indistinguishable.Diabetes.1993;42:658-661 ▲
- Orskov C, Rabenhoj L, Wettergren A, Kofod H, Holst JJ. Tissue and plasma concentrations of amidated and glycine-extended glucagon-likepeptide I in humans. Diabetes.1994;43:535-539. ▲
- Kieffer TJ, Habener JF: The glucagon like peptides. Endocr Rev 1999;20:876 913. ▲
- Deacon CF, Nauck MA, Toft Nielsen M, Pridal L, Willms B, Holst JJ: Both subcutaneously and intravenously administered glucagon like peptide I are rapidly degraded from the NH2 terminus in type II diabetic patients and in healthy subjects. Diabetes.1995;44:1126 1131. ▲
- Orskov C, Holst JJ, Knuhtsen S, Baldissera FG, Poulsen SS, Nielsen OV: Glucagon like peptides GLP 1 and GLP 2, predicted products of the glucagon gene, are secreted separately from pig small intestine but not pancreas. Endocrinology 1986;119:1467 1475. ▲
- Holst JJ: Glucagon like Peptide 1(GLP 1): an intestinal hormone signalling nutritional abundance, with an unusual therapeutic potential. Trends Endocrinol Metab.1999;10:229 235. ▲
- Drucker DJ: Glucagon like peptides. Diabetes 1998;47:159 169. ▲
- Zander M, Madsbad S, Madsen, JL, Holst JJ: Effect of 6 week course of glucagon like peptide 1 on glycaemic control, insulin sensitivitiy, and β cell function in type 2 diabetes: a parallel group study. Lancet 2002;359:824 830. ▲
- Parkes DG, Pittner R, Jodka C, Smith P, Young A: Insulinotropic actions of exendin 4 and glucagon like peptide 1 in vivo and in vitro. Metabolism 2001;50:583 589. ▲
- Zander M, Madsbad S, Madsen, JL, Holst JJ: Effect of 6 week course of glucagon like peptide 1 on glycaemic control, insulin sensitivitiy, and β cell function in type 2 diabetes: a parallel group study. Lancet 2002;359:824 830. ▲
- Rayner CK, Samsom M, Jones KL, Horowitz M: Relationships of upper gastrointestinal motor and sensory function with glycemic control. Diabetes Care 2001;24:371 381. ▲
- Kieffer TJ, Habener JF: The glucagon like peptides. Endocr Rev 1999;20:876 913. ▲
- Flint A, Raben A, Astrup A, Holst JJ: Glucagon like peptide 1 promotes satiety and suppresses energy intake in humans. J Clin Invest 1998;101:515 520. ▲
- Naslund E, Barkeling B, King N, Gutniak M, Blundell JE, Holst JJ, Rossner S, Hellstrom PM: Energy intake and appetite are suppressed by glucagon like peptide 1 (GLP 1) in obese men. Int J Obes Relat Metab Disord 1999;23:304 311. ▲
- Gutzwiller JP, Drewe J, Goke B, Schmidt H, Rohrer B, Lareida J, Beglinger C: Glucagon like peptide 1 promotes satiety and reduces food intake in patients with diabetes mellitus type 2. Am J Physiol 1999;276:R1541 R1544. ▲
- Farilla L, Bulotta A, Hirshberg B, Li Calzi S, Khoury N, Noushmehr H, Bertolotto C, Di Mario U, Harlan DM, Perfetti R: Glucagon-like peptide 1 inhibits cell apoptosis and improves glucose responsiveness of freshly isolated human islets. Endocrinology 2003;144:5149-5158 ▲
- Tourrel C, Bailbe D, Meile MJ, Kergoat M, Portha B: Glucagon like peptide 1 and exendin 4 stimulate β-cell neogenesis in streptozotocin-treated newborn rats resulting in persistently improved glucose homeostasis at adult age. Diabetes 2001;50:1562 1570. ▲
- Tourrel C, Bailbe D, Lacorne M, Meile MJ, Kergoat M, Portha B: Persistent improvement of type 2 diabetes in the Goto Kakizaki rat model by expansion of the β-cell mass during the prediabetic period with glucagon like peptide 1 or exendin 4. Diabetes 2002;51:1443 1452. ▲
- Zhou J, Wang X, Pineyro MA, Egan JM: Glucagon like peptide 1 and exendin 4 convert pancreatic AR42J cells into glucagon and insulin producing cells. Diabetes 1999;48:2358 2366. ▲
- Perfetti R, Zhou J, Doyle ME, Egan JM: Glucagon like peptide 1 induces cell proliferation and pancreatic duodenum homeobox 1 expression and increases endocrine cell mass in the pancreas of old, glucose intolerant rats. Endocrinology 2000;141:4600 4605. ▲
- Villanueva-Penacarrillo ML, Alcantara AI, Clemente F, Delgado E, Valverde I: Potent glycogenic effect of GLP-1(7-36)amide in rat skeletal muscle. Diabetologia 1994;37:1163-1166. ▲
- Morales M, Lopez-Delgado MI, Alcantara A, Luque MA, Clemente F, Marquez L,Puente J, Vinambres C, Malaisse WJ, Villanueva-Penacarrillo ML, Valverde I: Preserved GLP-I effects on glycogen synthase a activity and glucose metabolismin isolated hepatocytes and skeletal muscle from diabetic rats. Diabetes 1997;46:1264-1269. ▲
- Merida E, Delgado E, Molina LM, Villanueva-Penacarrillo ML, Valverde I: Presence of glucagon and glucagon-like peptide-1-(7-36)amide receptors in solubilized membranes of human adipose tissue.J Clin Endocrinol Metab. 1993;77:1654-1657. ▲
- Furnsinn C, Ebner K, Waldhausl W: Failure of GLP-1(7-36)amide to affect glycogenesis in rat skeletal muscle. Diabetologia 1995;38:864-867. ▲
- Bullock BP, Heller RS, Habener JF: Tissue distribution of messenger ribonucleic acid encoding the rat glucagon-like peptide-1 receptor. Endocrinology 1996;137:2968-2978. ▲
- Bullock BP, Heller RS, Habener JF: Tissue distribution of messenger ribonucleic acid encoding the rat glucagon-like peptide-1 receptor. Endocrinology 1996;137:2968-2978. ▲
- Wei Y, Mojsov S: Tissue-specific expression of the human receptor for glucagon-like peptide-I: brain, heart and pancreatic forms have the same deduced amino acid sequences. FEBS Lett 1995;358:219-224. ▲
- Barragan JM, Rodriguez RE, Blazquez E: Changes in arterial blood pressure and heart rate induced by glucagon-likepeptide-1-(7-36) amide in rats. Am J Physiol 1994;266:E459-E466. ▲
- Gros R, You X, Baggio LL, Kabir MG, Sadi AM, Mungrue IN, Parker TG, Huang Q,Drucker DJ, Husain M: Cardiac function in mice lacking the glucagon-like peptide-1 receptor.Endocrinology 2003;144:2242-2252. ▲
- Deacon CF, Nauck MA, Toft Nielsen M, Pridal L, Willms B, Holst JJ: Both subcutaneously and intravenously administered glucagon like peptide I are rapidly degraded from the NH2 terminus in type II diabetic patients and in healthy subjects. Diabetes.1995;44:1126 1131. ▲
- Vilsbøll T, Agerso H, Krarup T, Holst JJ: Similar elimination rates of glucagon-like peptide-1 in obese type 2 diabetic patients and healthy subjects.J Clin Endocrinol Metab. 2003;88:220-224. ▲
- Kieffer TJ, McIntosh CHS, Pederson RA: Degradation of glucose dependent insulinotropic polypeptide and truncated glucagon like peptide 1 in vitro and in vivo by dipeptidyl peptidase IV. Endocrinology 1995;136:3585 3596. ▲
- Drucker DJ: Minireview: the glucagon like peptides. Endocrinology 2001;142:521 527. ▲
- Nauck MA et al. Normalization of fasting hyperglycaemia by exogenous glucagon-like peptide 1 (7-36 amide) in Type 2 (non-insulin-dependent) diabetic patients Diabetologia. 1993;36:741–744 ▲
- Gutniak M, Orskov C, Holst JJ, Ahren B, Efendic S: Antidiabetogenic effect of glucagon-like peptide-1 (7-36)amide in normal subjects and patients with diabetes mellitus. N Engl J Med.1992;326:1316-1322 ▲
- Zander M, Madsbad S, Madsen, JL, Holst JJ: Effect of 6 week course of glucagon like peptide 1 on glycaemic control, insulin sensitivitiy, and β cell function in type 2 diabetes: a parallel group study. Lancet 2002;359:824 830. ▲
- Juntti-Berggren L, Pigon J, Karpe F, Hamsten A, Gutniak M, Vignati L, Efendic S: The antidiabetogenic effect of GLP-1 is maintained during a 7-day treatment period and improves diabetic dyslipoproteinemia in NIDDM patients. Diabetes Care 1996;19:1200-1206. ▲
- Juntti-Berggren L, Pigon J, Karpe F, Hamsten A, Gutniak M, Vignati L, Efendic S: The antidiabetogenic effect of GLP-1 is maintained during a 7-day treatment period and improves diabetic dyslipoproteinemia in NIDDM patients. Diabetes Care 1996;19:1200-1206. ▲
- Larsen J, Hylleberg B, Ng K, Damsbo P: Glucagon-like peptide-1 infusion must be maintained for 24 h/day to obtain acceptable glycemia in type 2 diabetic patients who are poorly controlled on sulphonylurea treatment. Diabetes Care 2001;24:1416-1421 ▲
- Meneilly GS, Greig N, Tildesley H, Habener JF, Egan JM, Elahi D: Effects of 3 months of continuous subcutaneous administration of glucagon-like peptide 1 in elderly patients with type 2 diabetes. Diabetes Care 2003;26:2835-2841. ▲
- Meneilly GS, Greig N, Tildesley H, Habener JF, Egan JM, Elahi D: Effects of 3 months of continuous subcutaneous administration of glucagon-like peptide 1 in elderly patients with type 2 diabetes. Diabetes Care 2003;26:2835-2841. ▲
- Zander M, Christiansen A, Madsbad S, Holst JJ: Additive effects of glucagon-like peptide 1 and pioglitazone in patients with type 2 diabetes. Diabetes Care 2004;27:1910-1914. ▲
- Zander M, Christiansen A, Madsbad S, Holst JJ: Additive effects of glucagon-like peptide 1 and pioglitazone in patients with type 2 diabetes. Diabetes Care 2004;27:1910-1914. ▲
- Eng J, Kleinman WA, Singh L, Singh G, Raufman JP: Isolation and characterization of exendin 4, an exendin 3 analogue from Heloderma suspectum venom. J Biol Chem. 1992;267:7402 7405. ▲
- Young AA: Glucagon like peptide 1, exendin and insulin sensitivity. Hansen B, Shafrir E, Eds. In Insulin Resistance and Insulin Resistance Syndrome. New York, NY. Harwood Academic Press, 2002; p235 262. ▲
- Parkes DG, Pittner R, Jodka C, Smith P, Young A: Insulinotropic actions of exendin 4 and glucagon like peptide 1 in vivo and in vitro. Metabolism 2001;50:583 589. ▲
- Egan JM, Clocquet AR, Elahi D: The insulinotropic effect of acute exendin 4 administered to humans: comparison of nondiabetic state to type 2 diabetes. J Clin Endocrinol Metab 2002;87:1282 1290. ▲
- Kolterman OG, Buse JB, Fineman MS, Gaines E, Heintz S, Bicsak TA, Taylor K, Kim D, Aisporna M, Wang Y, Baron AD: Synthetic exendin 4 (exenatide) significantly reduces postprandial and fasting plasma glucose in subjects with type 2 diabetes. J Clin Endocrinol Metab 2003;88:3082 3089. ▲
- Parkes DG, Pittner R, Jodka C, Smith P, Young A: Insulinotropic actions of exendin 4 and glucagon like peptide 1 in vivo and in vitro. Metabolism 2001;50:583 589. ▲
- Kieffer TJ, Habener JF: The glucagon like peptides. Endocr Rev 1999;20:876 913 ▲
- Tourrel C, Bailbe D, Meile MJ, Kergoat M, Portha B: Glucagon like peptide 1 and exendin 4 stimulate β-cell neogenesis in streptozotocin-treated newborn rats resulting in persistently improved glucose homeostasis at adult age. Diabetes 2001;50:1562 1570. ▲
- Tourrel C, Bailbe D, Lacorne M, Meile MJ, Kergoat M, Portha B: Persistent improvement of type 2 diabetes in the Goto Kakizaki rat model by expansion of the β-cell mass during the prediabetic period with glucagon like peptide 1 or exendin 4. Diabetes 2002;51:1443 1452. ▲
- Zhou J, Wang X, Pineyro MA, Egan JM: Glucagon like peptide 1 and exendin 4 convert pancreatic AR42J cells into glucagon and insulin producing cells. Diabetes 1999;48:2358 2366. ▲
- Perfetti R, Zhou J, Doyle ME, Egan JM: Glucagon like peptide 1 induces cell proliferation and pancreatic duodenum homeobox 1 expression and increases endocrine cell mass in the pancreas of old, glucose intolerant rats. Endocrinology 2000;141:4600 4605. ▲
- Xu G, Stoffers DA, Habener JF, Bonner Weir S: Exendin 4 stimulates both β cell replication and neogenesis, resulting in increased beta cell mass and improved glucose tolerance in diabetic rats. Diabetes 1999;48:2270 2276. ▲
- Bhavsar SP, Watkins JJ, Young AA: Comparison of central and peripheral effects of exendin 4 and GLP 1 on food intake in rats (Abstract). In Program and Abstracts: 80th Annual Meeting of the Endocrine Society 1998;A433. ▲
- Szayna M, Doyle ME, Betkey JA, Holloway HW, Spencer RGS, Greig NH, Egan JM: Exendin 4 decelerates food intake, weight gain, and fat deposition in Zucker rats. Endocrinology 2000;141:1936 1941. ▲
- Young AA, Gedulin BR, Bhavsar S, Bodkin N, Jodka C, Hansen B, Denaro M: Glucose lowering and insulin sensitizing actions of exendin 4: studies in obese diabetic (ob/ob, db/db) mice, diabetic fatty Zucker rats, and diabetic rhesus monkeys (Macaca mulatta). Diabetes 1999;48:1026 1034 ▲
- Edwards CMB, Stanley SA, Davis R, Brynes AE, Frost GS, Seal LJ, Ghatei MA, Bloom SR: Exendin 4 reduces fasting and postprandial glucose and decreases energy intake in healthy volunteers. Am J Physiol Endocrinol Metab 2001;281:E155 E161. ▲
- Kolterman OG, Kim DD, Shen L, Ruggles JA, Nielsen LL, Fineman MS, Baron AD: Pharmacokinetics, pharmacodynamics, and safety of exenatide in patients with type 2 diabetes mellitus. Amer J Health Sys Pharm 2005;62:173 181. ▲
- Kolterman OG, Kim DD, Shen L, Ruggles JA, Nielsen LL, Fineman MS, Baron AD: Pharmacokinetics, pharmacodynamics, and safety of exenatide in patients with type 2 diabetes mellitus. Amer J Health Sys Pharm 2005;62:173 181. ▲
- Amylin Pharmaceuticals, Inc. Byetta® (exenatide injection) package insert. San Diego CA:2006. ▲
- Heine RJ, Van Gaal LF, Johns D, Mihm MJ, Widel MH, Brodows RG; GWAA Study Group.Exenatide versus insulin glargine in patients with suboptimally controlled type 2 diabetes: a randomized trial.Ann Intern Med. 2005 Oct 18;143(8):559-69. ▲
- Buse JB, Henry RR, Han J, Kim DD, Fineman MS, Baron AD; for the Exenatide-113 Clinical Study Group: Effects of exenatide (exendin 4) on glycemic control over 30 weeks in sulfonylurea treated patients with type 2 diabetes. Diabetes Care 2004;27:2628 2635. ▲
- DeFronzo R, Ratner RE, Han J, Kim DD, Fineman MS, Baron AD: Effects of exenatide (exendin 4) on glycemic control and weight over 30 weeks in metformin treated patients with type 2 diabetes. Diabetes Care 2005;28:1092 1100. ▲
- Kendall DM, Riddle MC, Rosenstock J, Zhuang D, Kim DD, Fineman MS, Baron AD: Effects of exenatide (exendin 4) on glycemic control over 30 weeks in patients with type 2 diabetes treated with metformin and a sulfonylurea. Diabetes Care 2005;28:1083 1091. ▲
- Drucker DJ, Buse JB, taylor K, et al. Exenatide once weekly versus twice daily for the treatment of type 2 diabetes: a randomised, open-label, non-inferiority study. Lancet. 2008;372:1240–50 ▲
- Buse JB, Henry RR, Han J, Kim DD, Fineman MS, Baron AD; for the Exenatide-113 Clinical Study Group: Effects of exenatide (exendin 4) on glycemic control over 30 weeks in sulfonylurea treated patients with type 2 diabetes. Diabetes Care 2004;27:2628 2635. ▲
- DeFronzo R, Ratner RE, Han J, Kim DD, Fineman MS, Baron AD: Effects of exenatide (exendin 4) on glycemic control and weight over 30 weeks in metformin treated patients with type 2 diabetes. Diabetes Care 2005;28:1092 1100. ▲
- Kendall DM, Riddle MC, Rosenstock J, Zhuang D, Kim DD, Fineman MS, Baron AD: Effects of exenatide (exendin 4) on glycemic control over 30 weeks in patients with type 2 diabetes treated with metformin and a sulfonylurea. Diabetes Care 2005;28:1083 1091. ▲
- Fineman MS, Shen LZ, Taylor K, Kim DD, Baron AD: Effectiveness of progressive dose escalation of exenatide (exendin 4) in reducing dose limiting side effects in subjects with type 2 diabetes. Diabetes Metab Res Rev 2004;20:411 417. ▲
- http://www.accessdata.fda.gov/drugsatfda_docs/label/2008/021773s012lbl.pdf ▲
- http://www.fda.gov/Drugs/DrugSafety/PostmarketDrugSafetyInformationforPatientsandProviders/DrugSafetyInformationforHeathcareProfessionals/ucm188656.htm ▲
- Buse JB, Henry RR, Han J, Kim DD, Fineman MS, Baron AD; for the Exenatide-113 Clinical Study Group: Effects of exenatide (exendin 4) on glycemic control over 30 weeks in sulfonylurea treated patients with type 2 diabetes. Diabetes Care 2004;27:2628 2635. ▲
- DeFronzo R, Ratner RE, Han J, Kim DD, Fineman MS, Baron AD: Effects of exenatide (exendin 4) on glycemic control and weight over 30 weeks in metformin treated patients with type 2 diabetes. Diabetes Care 2005;28:1092 1100. ▲
- Kendall DM, Riddle MC, Rosenstock J, Zhuang D, Kim DD, Fineman MS, Baron AD: Effects of exenatide (exendin 4) on glycemic control over 30 weeks in patients with type 2 diabetes treated with metformin and a sulfonylurea. Diabetes Care 2005;28:1083 1091. ▲
- Garber A, Henry R, Ratner R, et al. Liraglutide versus glimepiride monotherapy for type 2 diabetes (LEAD-3 Mono): a randomised, 52-week, phase III, double-blind, parallel-treatment trial. Lancet. 2009;373:473–81 ▲
- Marre M, Shaw J, Brandle M, et al. Liraglutide, a once-daily human GLP-1 analogue, added to a sulphonylurea over 26 weeks produces greater improvements in glycaemic and weight control compared with adding rosiglitazone or placebo in subjects with type 2 diabetes (LEAD-1 SU). Diabet Med. 2009;26:268–78 ▲
- Nauck M, Frid A, Hermansen K, et al. Efficacy and safety comparison of liraglutide, glimepiride, and placebo, all in combination with metformin, in type 2 diabetes: the LEAD (Liraglutide Effect and Action in Diabetes)-2 study. Diabetes Care. 2009;32:84–90 ▲
- Russell-Jones D, Vaag A, Schmitz O, et al. Liraglutide versus insulin glargine in combination with metformin and sulfonylurea therapy in type 2 diabetes: A randomized controlled trial (LEAD-5 met+SU). Diabetologia. 2009t;52(10):2046-55 ▲
- Zinman B, Gerich J, Buse JB, et al. Efficacy and safety of the human glucagon-like peptide-1 analog liraglutide in combination with metformin and thiazolidinedione in patients with type 2 diabetes (LEAD-4 Met+tZD). Diabetes Care. 2009;32:1224–30 ▲
- Marre M, Shaw J, Brandle M, et al. Liraglutide, a once-daily human GLP-1 analogue, added to a sulphonylurea over 26 weeks produces greater improvements in glycaemic and weight control compared with adding rosiglitazone or placebo in subjects with type 2 diabetes (LEAD-1 SU). Diabet Med. 2009;26:268–78 ▲
- Nauck M, Frid A, Hermansen K, et al. Efficacy and safety comparison of liraglutide, glimepiride, and placebo, all in combination with metformin, in type 2 diabetes: the LEAD (Liraglutide Effect and Action in Diabetes)-2 study. Diabetes Care. 2009;32:84–90 ▲
- Zinman B, Gerich J, Buse JB, et al. Efficacy and safety of the human glucagon-like peptide-1 analog liraglutide in combination with metformin and thiazolidinedione in patients with type 2 diabetes (LEAD-4 Met+tZD). Diabetes Care. 2009;32:1224–30 ▲
- Garber A, Henry R, Ratner R, et al. Liraglutide versus glimepiride monotherapy for type 2 diabetes (LEAD-3 Mono): a randomised, 52-week, phase III, double-blind, parallel-treatment trial. Lancet. 2009;373:473–81 ▲
- Nauck M, Frid A, Hermansen K, et al. Efficacy and safety comparison of liraglutide, glimepiride, and placebo, all in combination with metformin, in type 2 diabetes: the LEAD (Liraglutide Effect and Action in Diabetes)-2 study. Diabetes Care. 2009;32:84–90 ▲
- Russell-Jones D, Vaag A, Schmitz O, et al. Liraglutide versus insulin glargine in combination with metformin and sulfonylurea therapy in type 2 diabetes: A randomized controlled trial (LEAD-5 met+SU). Diabetologia. 2009t;52(10):2046-55 ▲
- Zinman B, Gerich J, Buse JB, et al. Efficacy and safety of the human glucagon-like peptide-1 analog liraglutide in combination with metformin and thiazolidinedione in patients with type 2 diabetes (LEAD-4 Met+tZD). Diabetes Care. 2009;32:1224–30 ▲
- Marre M, Shaw J, Brandle M, et al. Liraglutide, a once-daily human GLP-1 analogue, added to a sulphonylurea over 26 weeks produces greater improvements in glycaemic and weight control compared with adding rosiglitazone or placebo in subjects with type 2 diabetes (LEAD-1 SU). Diabet Med. 2009;26:268–78 ▲
- Russell-Jones D, Vaag A, Schmitz O, et al. Liraglutide versus insulin glargine in combination with metformin and sulfonylurea therapy in type 2 diabetes: A randomized controlled trial (LEAD-5 met+SU). Diabetologia. 2009t;52(10):2046-55 ▲
- Zinman B, Gerich J, Buse JB, et al. Efficacy and safety of the human glucagon-like peptide-1 analog liraglutide in combination with metformin and thiazolidinedione in patients with type 2 diabetes (LEAD-4 Met+tZD). Diabetes Care. 2009;32:1224–30 ▲
- Drucker DJ. Minireview: the glucagon-like peptides. Endocrinology 2001; 142:521-527. ▲
- Ahren B. Glucagon-like peptide-1 (GLP-1): a gut hormone of potential interest in the treatment of diabetes. Bioessays 1998; 20:642-651. ▲
- Holst JJ, Deacon CF. Inhibition of the activity of dipeptidyl peptidase IV as a treatment for type 2 diabetes. Diabetes 1998; 47:1663-1670. ▲
- Holst JJ, Deacon CF. Inhibition of the activity of dipeptidyl peptidase IV as a treatment for type 2 diabetes. Diabetes 1998; 47:1663-1670. ▲
- Deacon CF, Hughes TE, Holst JJ. Dipeptidyl peptidase IV inhibition potentiates the insulinotropic effect of glucagon-like peptide 1 in the anesthetized pig. Diabetes 1998; 47:764-769. ▲
- Hughes TE, Mone MD, Russell ME, Weldon SC, Villhauer EB. NVP-DPP728 (1-[[[2-[(5-cyanopyridin-2-yl)amino]ethyl]amino]acetyl]-2-cyano-(S)- pyrrolidine), a slow-binding inhibitor of dipeptidyl peptidase IV. Biochemistry 1999; 38:11597-11603. ▲
- Villhauer EB, Brinkman JA, Naderi GB et al. 1-[2-[(5-Cyanopyridin-2-yl)amino]ethylamino]acetyl-2-(S)-pyrrolidinecarbonitrile: a potent, selective, and orally bioavailable dipeptidyl peptidase IV inhibitor with antihyperglycemic properties. J Med Chem 2002; 45:2362-2365. ▲
- Deacon CF, Ahren B, Holst JJ. Inhibitors of dipeptidyl peptidase IV: a novel approach for the prevention and treatment of type 2 diabetes? Expert Opin Investig Drugs 2004; 13:1091-1102. ▲
- Demuth HU, McIntosh CH, Pederson RA. Type 2 diabetes--therapy with dipeptidyl peptidase IV inhibitors. Biochim Biophys Acta 2005; 1751:33-44 ▲
- Lankas GR, Leiting B, Roy RS et al. Dipeptidyl peptidase IV inhibition for the treatment of type 2 diabetes: potential importance of selectivity over dipeptidyl peptidases 8 and 9. Diabetes 2005; 54:2988-2994 ▲
- Conarello SL, Li Z, Ronan J et al. Mice lacking dipeptidyl peptidase IV are protected against obesity and insulin resistance. Proc Natl Acad Sci USA 2003; 100:6825-6830 ▲
- Hughes TE, Mone MD, Russell ME, Weldon SC, Villhauer EB. NVP-DPP728 (1-[[[2-[(5-cyanopyridin-2-yl)amino]ethyl]amino]acetyl]-2-cyano-(S)- pyrrolidine), a slow-binding inhibitor of dipeptidyl peptidase IV. Biochemistry 1999; 38:11597-11603. ▲
- Villhauer EB, Brinkman JA, Naderi GB et al. 1-[2-[(5-Cyanopyridin-2-yl)amino]ethylamino]acetyl-2-(S)-pyrrolidinecarbonitrile: a potent, selective, and orally bioavailable dipeptidyl peptidase IV inhibitor with antihyperglycemic properties. J Med Chem 2002; 45:2362-2365. ▲
- Balkan B, Kwasnik L, Miserendino R, Holst JJ, Li X. Inhibition of dipeptidyl peptidase IV with NVP-DPP728 increases plasma GLP-1 (7-36 amide) concentrations and improves oral glucose tolerance in obese Zucker rats. Diabetologia 1999; 42:1324-1331. ▲
- Mitani H, Takimoto M, Hughes TE, Kimura M. Dipeptidyl peptidase IV inhibition improves impaired glucose tolerance in high-fat diet-fed rats: study using a Fischer 344 rat substrain deficient in its enzyme activity. Jpn J Pharmacol 2002; 88:442-450. ▲
- Mitani H, Takimoto M, Kimura M. Dipeptidyl peptidase IV inhibitor NVP-DPP728 ameliorates early insulin response and glucose tolerance in aged rats but not in aged fischer 344 rats lacking its enzyme activity. Jpn J Pharmacol 2002; 88:451-458. ▲
- Mitani H, Takimoto M, Kimura M. Dipeptidyl peptidase IV inhibitor NVP-DPP728 ameliorates early insulin response and glucose tolerance in aged rats but not in aged fischer 344 rats lacking its enzyme activity. Jpn J Pharmacol 2002; 88:451-458. ▲
- Ahren B, Simonsson E, Larsson H et al. Inhibition of dipeptidyl peptidase IV improves metabolic control over a 4-week study period in type 2 diabetes. Diabetes Care 2002; 25:869-875. ▲
- Miller S, St Onge EL. Sitagliptin: a dipeptidyl peptidase IV inhibitor for the treatment of type 2 diabetes. Ann Pharmacother 2006; 40:1336-1343 ▲
- Aschner P, Kipnes MS, Lunceford JK, et al. Effect of the dipeptidyl peptidase-4 inhibitor sitagliptin as monotherapy on glycemic control in patients with type 2 diabetes. Diabetes Care.2006;29:2632–7 ▲
- Hanefeld M, Herman GA, Wu M, et al. Once-daily sitagliptin, a dipeptidyl peptidase-4 inhibitor, for the treatment of patients with type 2 diabetes. Curr Med Res Opin. 2007;23:1329–39 ▲
- Raz I, Hanefeld M, Xu L, et al. Efficacy and safety of the dipeptidyl peptidase-4 inhibitor sitagliptin as monotherapy in patients with type 2 diabetes mellitus. Diabetologia. 2006;49:2564–71 ▲
- Charbonnel B, Karasik A, Liu J, et al. Efficacy and safety of the dipeptidyl peptidase-4 inhibitor sitagliptin added to ongoing metformin therapy in patients with type 2 diabetes inadequately controlled with metformin alone. Diabetes Care. 2006;29:2638 ▲
- Goldstein BJ, Feinglos MN, Lunceford JK, et al. Effect of initial combination therapy with sitagliptin, a dipeptidyl peptidase-4 inhibitor, and metformin on glycemic control in patients with type 2 diabetes. Diabetes Care. 2007;30:1979–87 ▲
- Raz I, Chen Y, Wu M, et al. Efficacy and safety of sitagliptin added to ongoing metformin therapy in patients with type 2 diabetes. Curr Med Res Opin. 2008;537 ▲
- DeFronzo RA, Fleck PR, Wilson CA, Mekki Q. Efficacy and safety f the dipeptidyl peptidase-4 inhibitor alogliptin in patients with ype 2 diabetes and inadequate glycemic control: a randomized, double-blind, placebo-controlled study. Diabetes Care. 008;31:2315–7. ▲
- Charbonnel B, Karasik A, Liu J, et al. Efficacy and safety of the dipeptidyl peptidase-4 inhibitor sitagliptin added to ongoing metformin therapy in patients with type 2 diabetes inadequately controlled with metformin alone. Diabetes Care. 2006;29:2638 ▲
- Raz I, Chen Y, Wu M, et al. Efficacy and safety of sitagliptin added to ongoing metformin therapy in patients with type 2 diabetes. Curr Med Res Opin. 2008;537 ▲
- Hermansen K, Kipnes M, Luo E, et al. Efficacy and safety of the dipeptidyl peptidase-4 inhibitor, sitagliptin, in patients with type 2 diabetes mellitus inadequately controlled on glimepiride alone or on glimepiride and metformin. Diabetes Obes Metab.2007;9:733–45. ▲
- Rosenstock J, Brazg R, Andryuk PJ, et al. Efficacy and safety of he dipeptidyl peptidase-4 inhibitor sitagliptin added to ongoing ioglitazone therapy in patients with type 2 diabetes: a 24-week, mlticenter, randomized, double-blind, placebo-controlled, parallel-group study.Clin ther. 2006;28:1556–68 ▲
- Nauck MA, Ellis GC, Fleck PR, et al. Efficacy and safety of adding he dipeptidyl peptidase-4 inhibitor alogliptin to metformin therapy in patients with type 2 diabetes inadequately controlled with mtformin monotherapy: a multicentre, randomised, doubleblind, placeb cotrolled study. Int J Clin Pract. 2009;63:46–55 ▲
- Pratley RE, Kipnes MS, Fleck PR, et al. Efficacy and safety of the ipeptidyl peptidase-4 inhibitor alogliptin in patients with type diabetes inadequately controlled by glyburide monotherapy.Diabetes Obes Mtab. 2009;11:167–76. ▲
- Aschner P, Kipnes MS, Lunceford JK, et al. Effect of the dipeptidyl peptidase-4 inhibitor sitagliptin as monotherapy on glycemic control in patients with type 2 diabetes. Diabetes Care.2006;29:2632–7 ▲
- Hanefeld M, Herman GA, Wu M, et al. Once-daily sitagliptin, a dipeptidyl peptidase-4 inhibitor, for the treatment of patients with type 2 diabetes. Curr Med Res Opin. 2007;23:1329–39 ▲
- Raz I, Hanefeld M, Xu L, et al. Efficacy and safety of the dipeptidyl peptidase-4 inhibitor sitagliptin as monotherapy in patients with type 2 diabetes mellitus. Diabetologia. 2006;49:2564–71 ▲
- Charbonnel B, Karasik A, Liu J, et al. Efficacy and safety of the dipeptidyl peptidase-4 inhibitor sitagliptin added to ongoing metformin therapy in patients with type 2 diabetes inadequately controlled with metformin alone. Diabetes Care. 2006;29:2638 ▲
- Goldstein BJ, Feinglos MN, Lunceford JK, et al. Effect of initial combination therapy with sitagliptin, a dipeptidyl peptidase-4 inhibitor, and metformin on glycemic control in patients with type 2 diabetes. Diabetes Care. 2007;30:1979–87 ▲
- Raz I, Chen Y, Wu M, et al. Efficacy and safety of sitagliptin added to ongoing metformin therapy in patients with type 2 diabetes. Curr Med Res Opin. 2008;537 ▲
- DeFronzo RA, Fleck PR, Wilson CA, Mekki Q. Efficacy and safety f the dipeptidyl peptidase-4 inhibitor alogliptin in patients with ype 2 diabetes and inadequate glycemic control: a randomized, double-blind, placebo-controlled study. Diabetes Care. 008;31:2315–7. ▲
- Hermansen K, Kipnes M, Luo E, et al. Efficacy and safety of the dipeptidyl peptidase-4 inhibitor, sitagliptin, in patients with type 2 diabetes mellitus inadequately controlled on glimepiride alone or on glimepiride and metformin. Diabetes Obes Metab.2007;9:733–45. ▲
- Ravichandran S, Chacra AR, tan GH, et al. Saxagliptin added to a submaximal dose of sulphonylurea improves glycaemic control compared with uptitration of sulphonylurea in patients with type 2 diabetes: a randomised controlled trial.Int J Clin Pract. 2009 Sep;63(9):1395-406 ▲
- Allen E, Hollander P, Li J, Chen R, the Life Study Group. Saxagliptin added to a thiazolidinedione improves glycaemic control in patients with inadequately controlled type 2 diabetes: systematic review and meta-analysis. Diabetologia. 2008;511):S78. ▲
- Garg A, Grundy SM. Cholestyramine therapy for dyslipidemia in non-insulin-dependent diabetes mellitus. A short-term, double-blind, crossover trial. Ann Intern Med. 1994;121 :416-422. ▲
- Thomson AB, Keelan M. Feeding rats diets containing cheno- or ursodeoxycholic acid or cholestyramine modifies intestinal uptake of glucose and lipids. Digestion.1987;38:160-170 ▲
- Bays HE, Cohen DE. Rationale and design of a prospective clinical trial program to evaluate the glucose-lowering effects ofcolesevelam HCI in patients with type 2 diabetes mellitus. Curr Med Res Opin. 2007;23: 1673-1684 ▲
- Bays HE, Cohen DE. Rationale and design of a prospective clinical trial program to evaluate the glucose-lowering effects ofcolesevelam HCI in patients with type 2 diabetes mellitus. Curr Med Res Opin. 2007;23: 1673-1684 ▲
- Bays HE, Cohen DE. Rationale and design of a prospective clinical trial program to evaluate the glucose-lowering effects of colesevelam HCl in patients with type 2 diabetes mellitus. Curr Med Res Opin. 2007;23:1673-1684. ▲
- Bays HE, Goldberg RB, Truitt KE, Jones MR.Colesevelam HCl in diabetes patients treated with metformin:glucose and lipid effects. Arch Intern Med. 2008. 13;168:1975-83 ▲
- Fonseca VA, Rosenstock J, Wang AC, Truitt KE, Jones MR. Colesevelam HCl improves glycemic control and reduces LDL-cholesterol in patients with type 2 diabetes inadequately controlled on sulfonylurea-based therapy Diabetes Care. 2008 ;31:1479-84 ▲
- Goldberg RB, Fonseca VA, Truitt KE, Jones MR. Efficacy and safety of colesevelam in patients with type 2 diabetes mellitus and inadequate glycemic control receiving insulin-based therapy. Arch Intern Med. 2008 28;168:1531-40 ▲
- Heller DP, Burke SK, Davidson OM, DonovanJM. Absorption of colesevelam hydrochloride in healthy volunteers. Ann Pharmacother. 2002;36:398-403. ▲
- Colesevelam hydrochloride (Welchol) [package insert]' Parsippany, NJ: Daiichi Sankyo, Inc; 2008. ▲
- PIJL H, OHASHI S, MATSUDA M. et al Bromocriptine A novel approach to the treatment of type 2 diabetesDiabetes Care, 2000 23:1154–1161 ▲
- http://www.accessdata.fda.gov/drugsatfda_docs/label/2009/020866lbl.pdf ▲
- PIJL H, OHASHI S, MATSUDA M. et al Bromocriptine A novel approach to the treatment of type 2 diabetesDiabetes Care, 2000 23:1154–1161 ▲
- http://www.accessdata.fda.gov/drugsatfda_docs/label/2009/020866lbl.pdf ▲
- Cooper GJ, Willis AC, Clark A, Turner RC, Sim RB, Reid KB. Purification and characterization of apeptide from amyloid-rich pancreasesof type 2 diabetic patients. Proc Nat Acad Sci U S A. 1987;84:8628-8632.14. ▲
- Hartter E, Svoboda T, Ludvik B, Schuller M, Lell B, Kuenburg E, Brunnbauer M, Woloszczuk W, Prager R.. Basal and stimulated plasma levelsof pancreatic amylin indicate itsco-secretion with insulin in humans.Diabetologia. 1991 ;34:52-54. ▲
- Koda JE, Fineman M, Rink TJ, Dailey GE, Muchmore DB, Linarelli LG. Amylin concentrations and glucose control. Lancet. 1992;339:1179-1180. ▲
- Ludvik B, Lell B, Hartter E, Schnack C, Prager R.l. Decrease of stimulated amylin release precedes impairment of insulin secretion in type 2 diabetes. Diabetes. 1991;40:1615-1619. ▲
- Gedulin BR, Rink TJ, Young AA. Dose-response for glucagonostatic effect of amylin in rats. Metabolism. 1997;46:67-70 ▲
- Young AA, Gedulin B, Vine W, Percy A, Rink TJ. Gastric emptying is accelerated indiabetic BB rats and is slowed bysubcutaneous injections of amylin.Diabetologia. 1995;38:642-648. ▲
- Fineman MS, Koda JE, Shen LZ, Strobel SA, Maggs DG, Weyer C, Kolterman OG.The human amylin analogue, pramlintide corrects postprandial hyperglucagonemia in patients with type 1 diabetes. Metabolism 2002;51:636–641 ▲
- Vella A, Lee JS, Camilleri M, Szarka A,Burton DD, Zinsmeister AR, Rizza RA,Klein PD. Effects of pramlintide, an amylin analogue, on gastric emptying in type 1 and 2 diabetes mellitus. Neurogastroenterol Motil 2002;14:123–131 ▲
- Chapman I, Parker B, Doran S, Feinle-Bisset C, Wishart J, Strobel S,WangY, Burns C, Lush C, Weyer C, Horowitz M. Effect of pramlintide on satiety and food intake in obese subjects and subjects with type 2 diabetes. Diabetologia 2005;48:838–848 ▲
- Thompson RG, Pearson L, Kolterman OG. Effect of 4 weeks’ administration of pramlintide, a human amylin analogue, on glycemic control in patients with IDDM: effects on plasma glucose profiles and fructosamine concentrations. Diabetologia 1997; 40:1278–1285. ▲
- Nyholm B, Orkov L, Hove KY, et al. The amylin analog pramlintide improves glycemic control in patients with type 1 diabetes mellitus. Metabolism 1999; 48:935–941. ▲
- Whitehouse F, Kruger DF, Fineman M, et al. A randomized study and open-label extension evaluating the long-term efficacy of pramlintide as an adjunct to insulin therapy in type 1 diabetes. Diabetes Care 2002; 24:724–730. ▲
- Weyer C, Gottlieb A, Kim DD, et al. Pramlintide reduces postprandial glucose excursions when added to regular insulin or insulin lispro in subjects with type 1 diabetes. Diabetes Care 2003; 26:3074–3079. ▲
- Hollander PA, Levy P, Fineman MS, et al. Pramlintide as an adjunct to insulin therapy improves long-term glycemic and weight control in patients with type 2 diabetes: a 1-year randomized controlled trial. Diabetes Care 2003; 26:784–790. ▲
- Ratner RE, Dickey R, Fineman M, et al. Amylin replacement with pramlintide as an adjunct to insulin therapy improves long-term glycemic and weight control in type 1 diabetes mellitus: a one year randomized controlled trial. Diabet Med 2004; 21:1204–1212. ▲
- Hollander P, Maggs DG, Ruggles JA, Fineman M, Shen L, Kolterman OG, Weyer C.. Effect of pramlintide on weight in overweight and obese insulin treated type 2 diabetes patients. Obes Res. 2004;12:661-668. ▲
- Whitehouse F, Kruger DF, Fineman M, et al. A randomized study and open-label extension evaluating the long-term efficacy of pramlintide as an adjunct to insulin therapy in type 1 diabetes. Diabetes Care 2002; 24:724–730. ▲
- Hollander PA, Levy P, Fineman MS, et al. Pramlintide as an adjunct to insulin therapy improves long-term glycemic and weight control in patients with type 2 diabetes: a 1-year randomized controlled trial. Diabetes Care 2003; 26:784–790. ▲
- Hollander P, Maggs DG, Ruggles JA, Fineman M, Shen L, Kolterman OG, Weyer C.. Effect of pramlintide on weight in overweight and obese insulin treated type 2 diabetes patients. Obes Res. 2004;12:661-668. ▲
- Whitehouse F, Kruger DF, Fineman M, et al. A randomized study and open-label extension evaluating the long-term efficacy of pramlintide as an adjunct to insulin therapy in type 1 diabetes. Diabetes Care 2002; 24:724–730. ▲
- Riddle M, Pencek R, Charenkavanich S, Lutz K, Wilhelm K, Porter L Randomized Comparison of Pramlintide or Mealtime Insulin Added to Basal Insulin Treatment for Patients With Type 2 Diabetes Diabetes Care 2009 32:1577-1582; ▲
- Riddle M, Pencek R, Charenkavanich S, Lutz K, Wilhelm K, Porter L Randomized Comparison of Pramlintide or Mealtime Insulin Added to Basal Insulin Treatment for Patients With Type 2 Diabetes Diabetes Care 2009 32:1577-1582; ▲
- Maggs D, Shen L, Strobel S, Brown D, Kolterman O, Weyer C Effect of pramlintide on A1C and body weight in insulin-treated African Americans and Hispanics with type 2 diabetes: A pooled post hoc analysis. Metabolism. 2003;52: 1638-1642. ▲
- Hollander P, Maggs DG, Ruggles JA, Fineman M, Shen L, Kolterman OG, Weyer C.. Effect of pramlintide on weight in overweight and obese insulin treated type 2 diabetes patients. Obes Res. 2004;12:661-668. ▲
- Di M, V, Petrocellis LD. Plant, synthetic, and endogenous cannabinoids in medicine. Annu Rev Med 2006; 57:553-574 ▲
- Zuardi AW. History of cannabis as a medicine: a review. Rev Bras Psiquiatr 2006; 28:153-157. ▲
- Gaoni Y, Mechoulam R. Isolation, structure, and partial synthesis of an active componenet of hashish. J Am Chem Soc 1964; 86:1646-1647. ▲
- Pagotto U, Marsicano G, Cota D, Lutz B, Pasquali R. The emerging role of the endocannabinoid system in endocrine regulation and energy balance. Endocr Rev 2006; 27:73-100. ▲
- Pagotto U, Marsicano G, Cota D, Lutz B, Pasquali R. The emerging role of the endocannabinoid system in endocrine regulation and energy balance. Endocr Rev 2006; 27:73-100. ▲
- Mackie K. Distribution of cannabinoid receptors in the central and peripheral nervous system. Handb Exp Pharmacol 2005;(168):299-325. ▲
- Kirkham TC, Tucci SA. Endocannabinoids in appetite control and the treatment of obesity. CNS Neurol Disord Drug Targets 2006; 5:272-292. ▲
- Jamshidi N, Taylor DA. Anandamide administration into the ventromedial hypothalamus stimulates appetite in rats. Br J Pharmacol 2001; 134:1151-1154 ▲
- Kirkham TC, Williams CM, Fezza F, Di M, V. Endocannabinoid levels in rat limbic forebrain and hypothalamus in relation to fasting, feeding and satiation: stimulation of eating by 2-arachidonoyl glycerol. Br J Pharmacol 2002; 136:550-557. ▲
- Hao S, Avraham Y, Mechoulam R, Berry EM. Low dose anandamide affects food intake, cognitive function, neurotransmitter and corticosterone levels in diet-restricted mice. Eur J Pharmacol 2000; 392:147-156. ▲
- Ravinet TC, Delgorge C, Menet C, Arnone M, Soubrie P. CB1 cannabinoid receptor knockout in mice leads to leanness, resistance to diet-induced obesity and enhanced leptin sensitivity. Int J Obes Relat Metab Disord 2004; 28:640-648. ▲
- Valverde O, Karsak M, Zimmer A. Analysis of the endocannabinoid system by using CB1 cannabinoid receptor knockout mice. Handb Exp Pharmacol 2005;(168):117-145 ▲
- Engeli S, Bohnke J, Feldpausch M et al. Activation of the peripheral endocannabinoid system in human obesity. Diabetes 2005; 54:2838-2843. ▲
- Sipe JC, Waalen J, Gerber A, Beutler E. Overweight and obesity associated with a missense polymorphism in fatty acid amide hydrolase (FAAH). Int J Obes (Lond) 2005; 29:755-759 ▲
- Gelfand EV, Cannon CP. Rimonabant: a cannabinoid receptor type 1 blocker for management of multiple cardiometabolic risk factors. J Am Coll Cardiol 2006; 47:1919-1926 ▲
- Scheen AJ, Van Gaal LG, Despres JP, Pi-Sunyer X, Golay A, Hanotin C. Rimonabant improves cardiometabolic risk profile in obese or overweight subjects: overview of RIO studies. Rev Med Suisse 2006; 2:1916-1923 ▲
- Gelfand EV, Cannon CP. Rimonabant: a selective blocker of the cannabinoid CB1 receptors for the management of obesity, smoking cessation and cardiometabolic risk factors. Expert Opin Investig Drugs 2006; 15:307-315. ▲
- Boyd ST, Fremming BA. Rimonabant--a selective CB1 antagonist. Ann Pharmacother 2005; 39:684-690. ▲
- Boyd ST, Fremming BA. Rimonabant--a selective CB1 antagonist. Ann Pharmacother 2005; 39:684-690. ▲
- Van Gaal LF, Rissanen AM, Scheen AJ, Ziegler O, Rossner S. Effects of the cannabinoid-1 receptor blocker rimonabant on weight reduction and cardiovascular risk factors in overweight patients: 1-year experience from the RIO-Europe study. Lancet 2005; 365:1389-1397. ▲
- Pi-Sunyer FX, Aronne LJ, Heshmati HM, Devin J, Rosenstock J. Effect of rimonabant, a cannabinoid-1 receptor blocker, on weight and cardiometabolic risk factors in overweight or obese patients: RIO-North America: a randomized controlled trial. J Am Med Assoc 2006; 295:761-775. ▲
- Despres JP, Golay A, Sjostrom L. Effects of rimonabant on metabolic risk factors in overweight patients with dyslipidemia. N Engl J Med 2005; 353:2121-2134. ▲
- Scheen AJ, Finer N, Hollander P, Jensen MD, Van Gaal LF, for the RIO-Diabetes Study Group: Efficacy and tolerability of rimonabant in overweight or obese patients with type 2 diabetes: a randomised controlled study. Lancet 368:1660–1672, 2006 ▲
- Scheen AJ, Finer N, Hollander P, Jensen MD, Van Gaal LF, for the RIO-Diabetes Study Group: Efficacy and tolerability of rimonabant in overweight or obese patients with type 2 diabetes: a randomised controlled study. Lancet 368:1660–1672, 2006 ▲
- 9. DeFronzo RA. Pharmacologic therapy for type 2 diabetes mellitus. Ann Intern Med 1999; 131:281-303. ▲
- Brower V. Proteomics: biology in the post-genomic era. Companies all over the world rush to lead the way in the new post-genomics race. EMBO Rep 2001; 2(7):558-560. ▲
- Hertzberg RP, Pope AJ. High-throughput screening: new technology for the 21st century. Curr Opin Chem Biol 2000; 4:445-451. ▲
- Toledo-Sherman LM, Chen D. High-throughput virtual screening for drug discovery in parallel. Curr Opin Drug Discov Devel 2002; 5:414-421. ▲
- Jhoti H. High-throughput structural proteomics using x-rays. Trends Biotechnol 2001; 19:S67-S71 ▲
- Blundell TL, Jhoti H, Abell C. High-throughput crystallography for lead discovery in drug design. Nat Rev Drug Discov 2002; 1:45-54. ▲
- Card GL, Blasdel L, England BP et al. A family of phosphodiesterase inhibitors discovered by cocrystallography and scaffold-based drug design. Nat Biotechnol 2005; 23:201-207. ▲
- Fischer HP. Towards quantitative biology: integration of biological information to elucidate disease pathways and to guide drug discovery. Biotechnol Annu Rev 2005; 11:1-68. ▲
- Michelson S. The impact of systems biology and biosimulation on drug discovery and development. Mol Biosyst 2006; 2:288-291. ▲
- Zimmet P, Alberti KG, Shaw J. Global and societal implications of the diabetes epidemic. Nature 2001; 414:782-787. ▲
- Kopelman PG. Obesity as a medical problem. Nature 2000; 404:635-643 ▲